Cookie Consent Management Dashboard
The Cookie consent dashboard provides an overview of the cookie consent requests based on different domains, tenants, etc. You can also find information related to the requests received from various regions. For navigating to the CCM dashboard,
Log into the Data Governance tool.
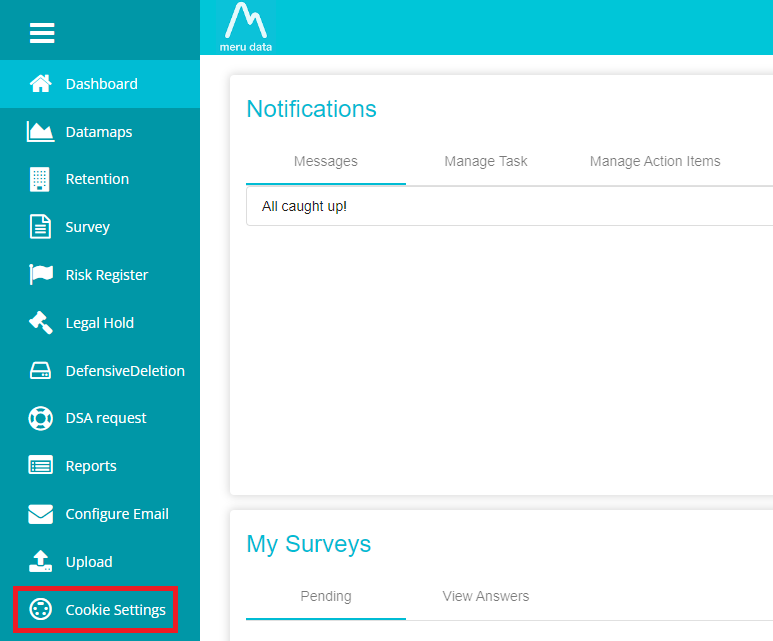
Click on the hamburger
 icon to open the menu.
Select ‘Cookie Settings’ from the menu.
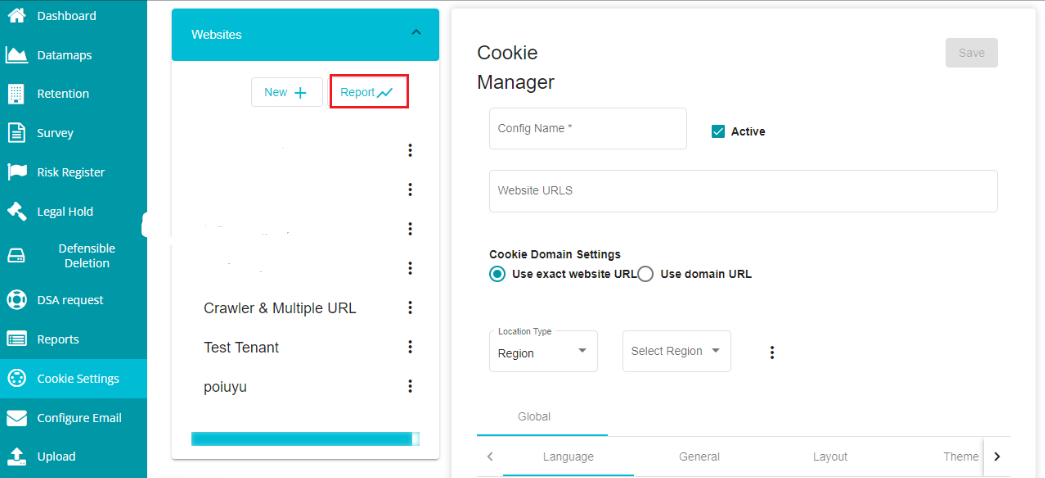
Click on ‘Report’ on the Cookie Settings screen.
The CCM dashboard appears on the screen, showing information represented as bar charts for different options like consent requests, domains, browsers, device type, and request by region.
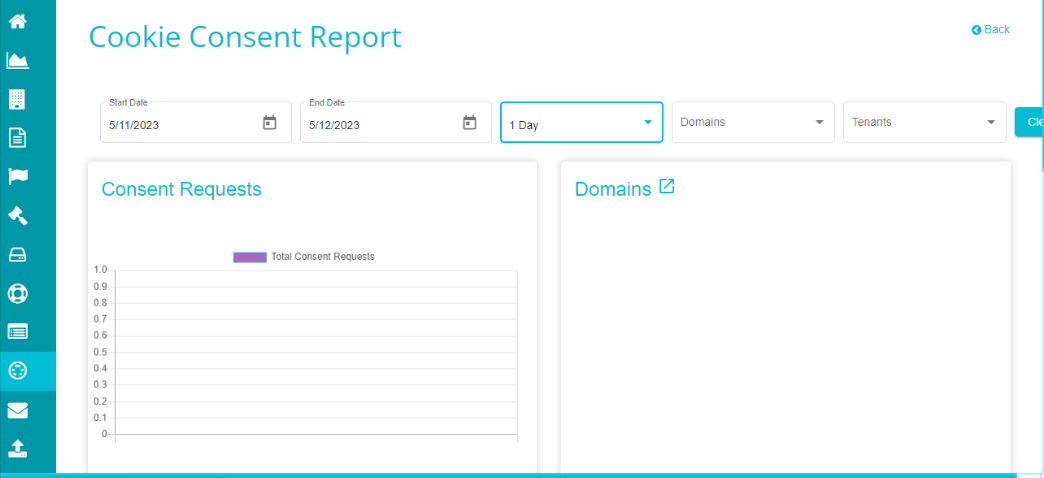
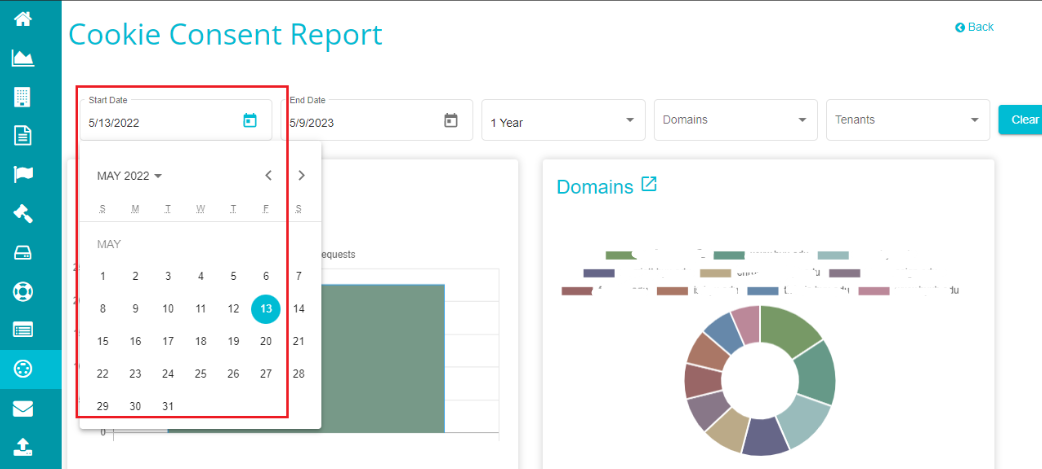
Start Date This option on the CCM screen shows the starting date of the reports being displayed. Usually, the start date defers based on the chosen duration for displaying the results. However, it can also be chosen by clicking on the calendar icon and selecting the required date.
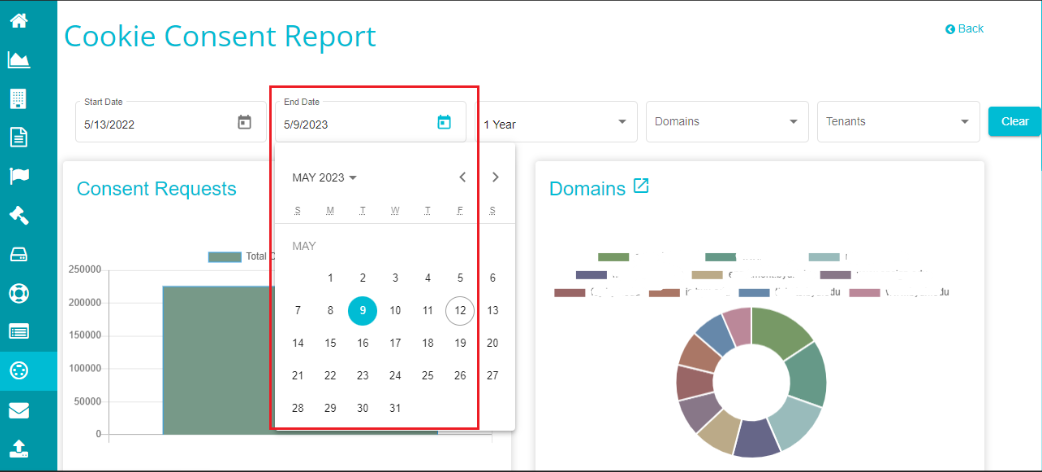
End Date End Date on the CCM screen refers to the last date of the reports being displayed. Like the start date, the end date can also be changed by clicking on the calendar icon. By default, end date is considered as the present date.
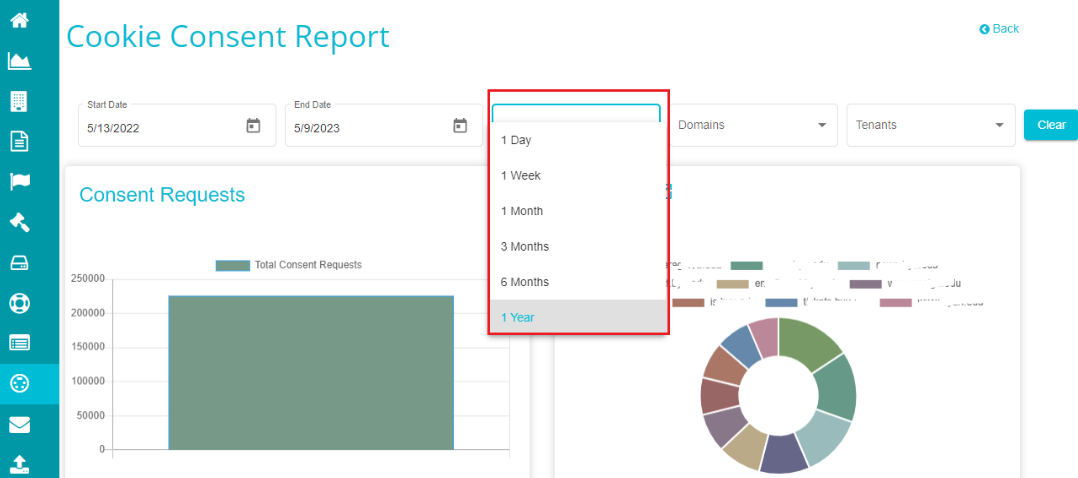
Duration This drop-down can be used to select the duration between which you want to see the cookie consent reports. By default, the duration is 1 day.
Domain Filter This drop-down menu contains the top ten domains from the entire list of domains. You can choose any domain from the list and every chart on the CCM dashboard represents information related to the selected domains.
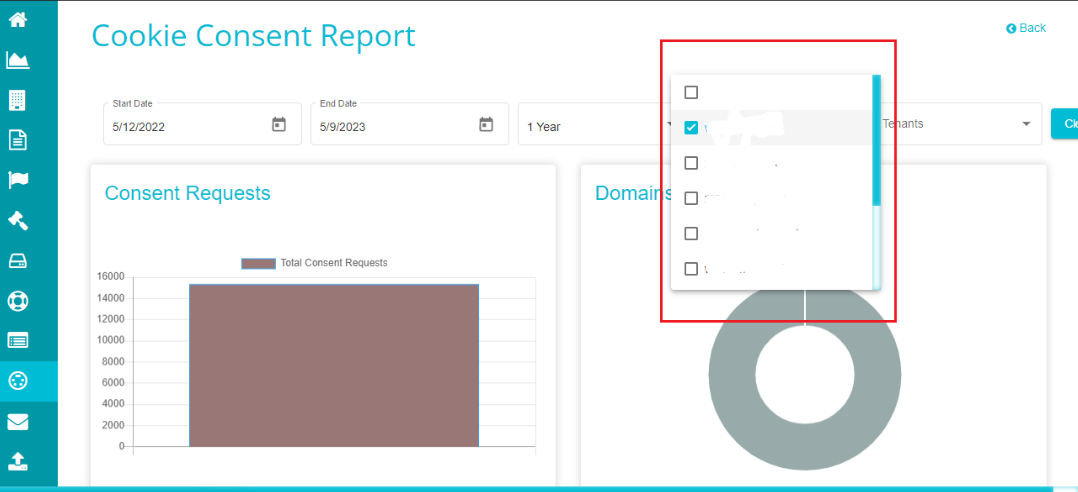
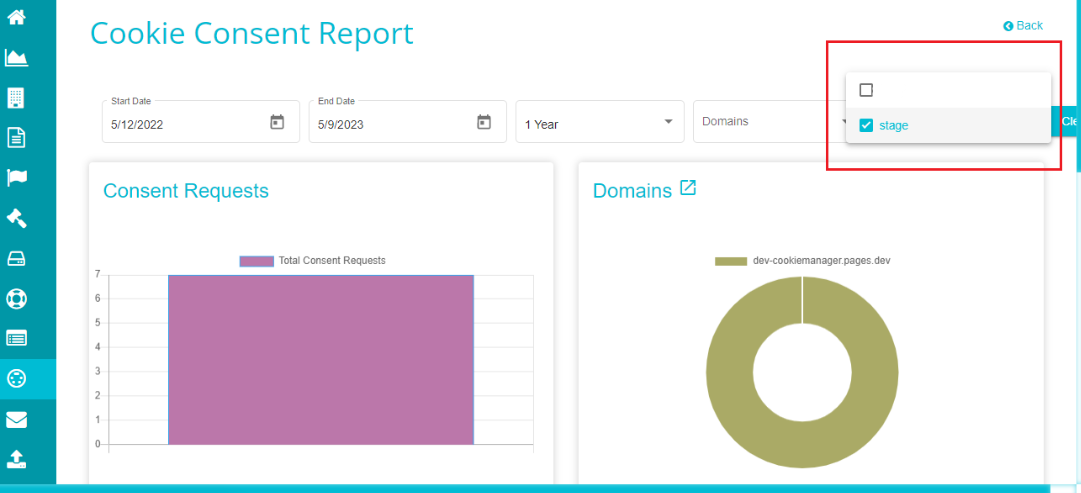
Tenants This drop-down shows the tenants for which you can view the cookie consent reports. Again, this selection reflects on the entire screen and every chart displays information based on the selected tenant.
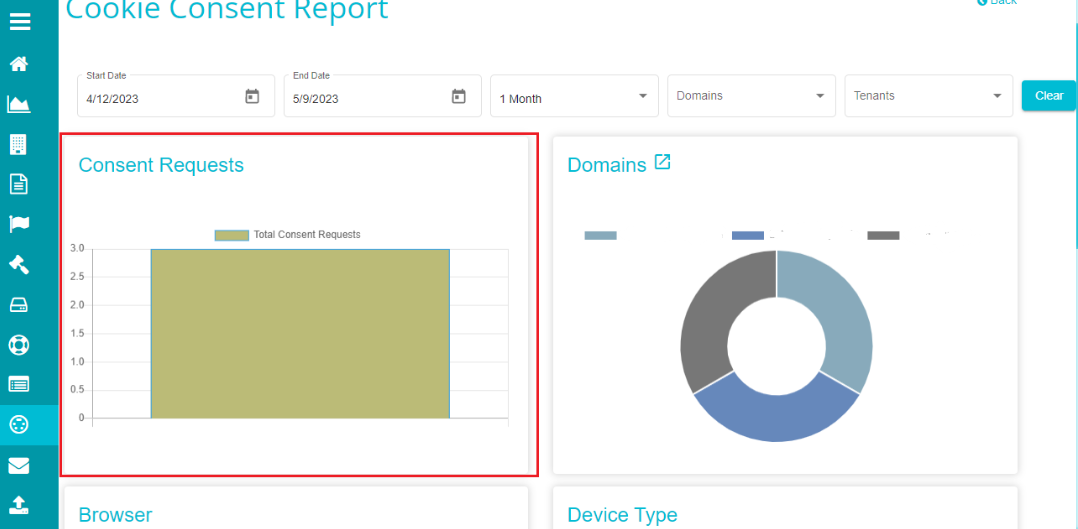
Consent Requests It shows the number of consent requests received within the selected duration, represented in a bar graph. The vertical scale on the graph represents the number of requests and varies based on the requests received.
Domains Domains on the CCM dashboard are represented in a pie chart with each color representing a specific domain related to the chosen tenant. Placing the cursor on any of the colors on the chart shows the domain name and the consent requests received within that domain for the selected duration.
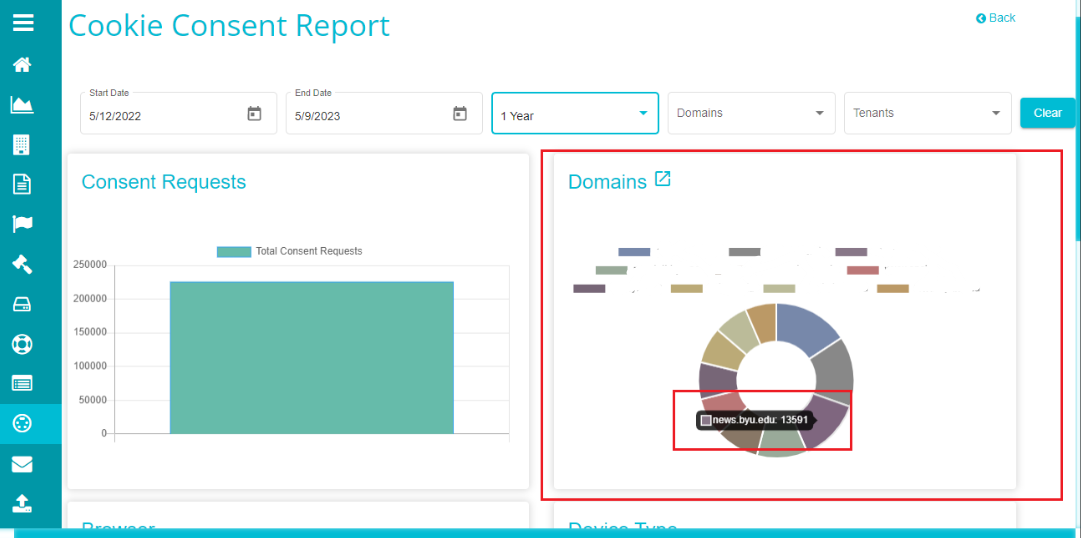 Here, the graph shows the information related to the top 10 domains related to the tenant. However, if you want to check the information related to every included domain,
click on present next to the Domains heading on the CCM screen.
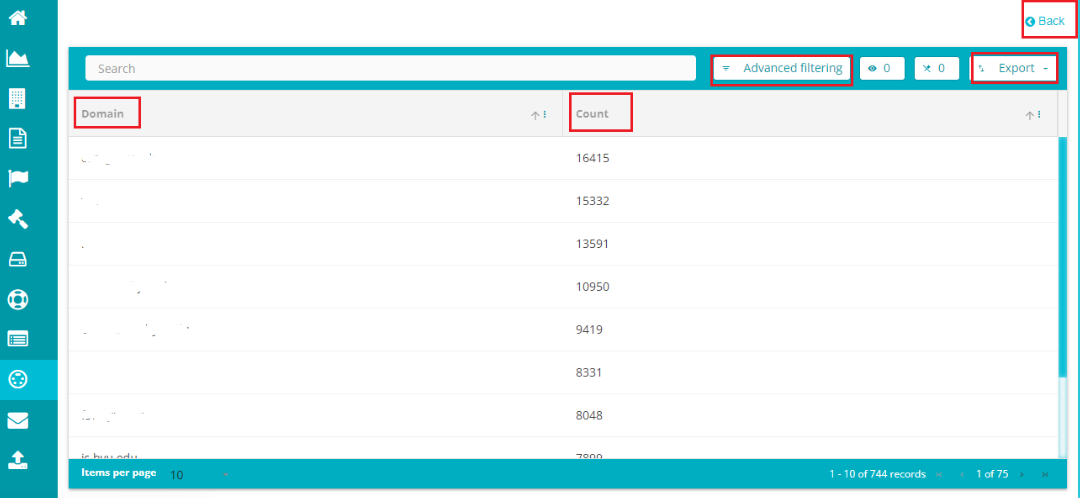
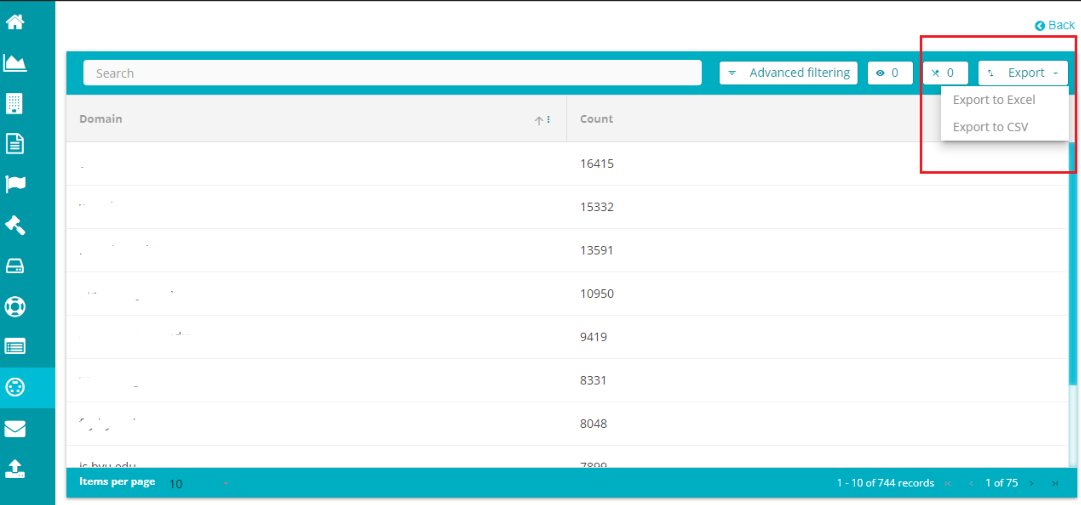
This selection takes you to the following screen displaying the information relevant to all the domains included.
Domain – this column displays the name of every domain included in the tenant.
Count – this column displays the number of consent requests received under the domain.
Export – this option can be used to export the information on the screen. Here, you can choose how the information is to be exported, i.e., in excel format or in CSV.
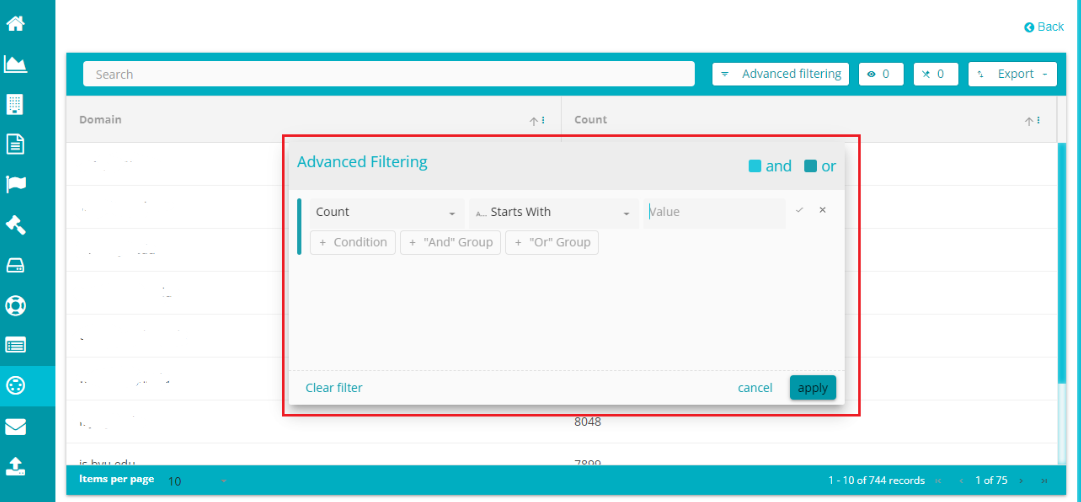
Advanced Filtering – this option lets you filter the domain-based information. This selection shows a pop-up screen to define an advanced filter and display the information matching the filters. You can define an ‘And’ or ‘Or’ filter for filtering the domain information.
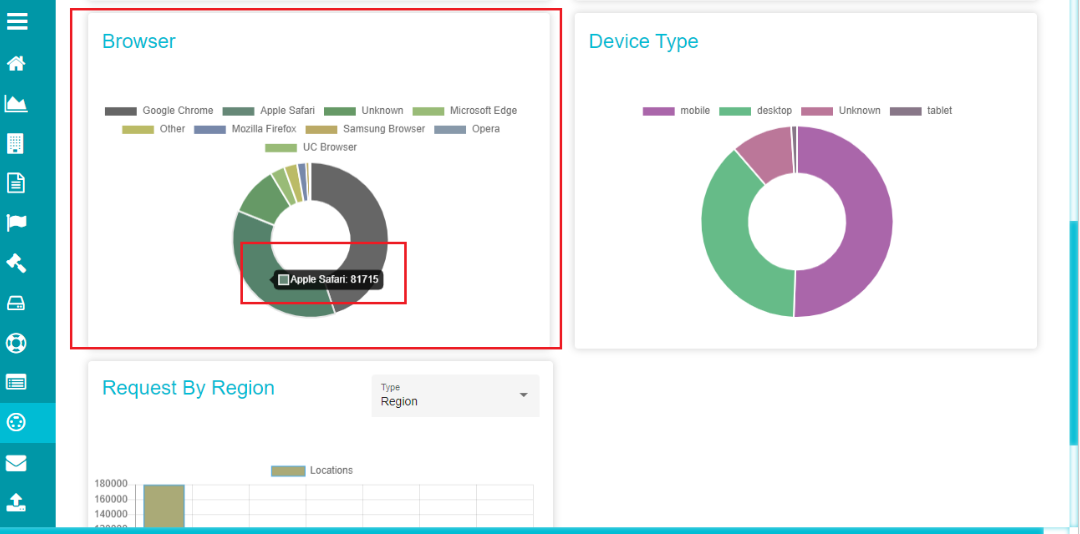
Browser This is another pie chart showing the information related to different browsers through which the cookie consent requests are placed. Each color on the chart represents a unique domain and placing the cursor on any of these color grids shows the browser represented by the color and the number of requests received through it.
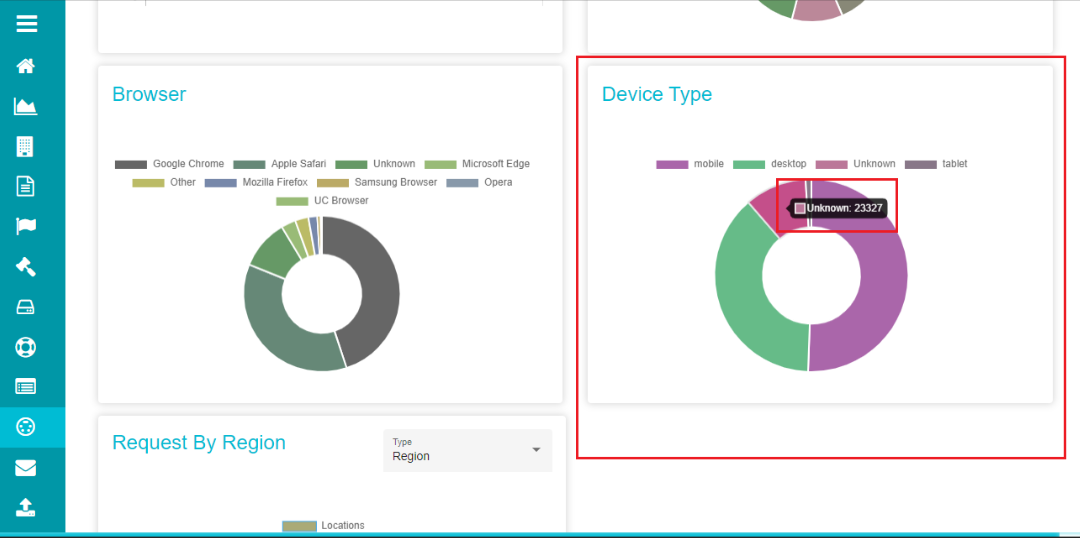
Device Type Like the Domains and Browser, Device Type is another pie chart showing the information related to different devices through which the cookie consent requests are placed. Each color on the chart represents a unique device and placing the cursor on any of these color grids shows the device represented by the color and the number of requests received through it.
Request by Region/ Country Like the other charts on the CCM screen, Request by Region/Country is another bar chart showing the information related to different regions/countries from which the cookie consent requests are placed. Each bar on the chart represents a unique region/country and placing the cursor on any of these color grids shows the region/country represented by the color and the number of requests received through it. You can use the ‘Type’ drop-down menu to select the region or country for displaying the results. The selection made here reflects on the entire CCM dashboard, changing the representations of every chart on the screen.
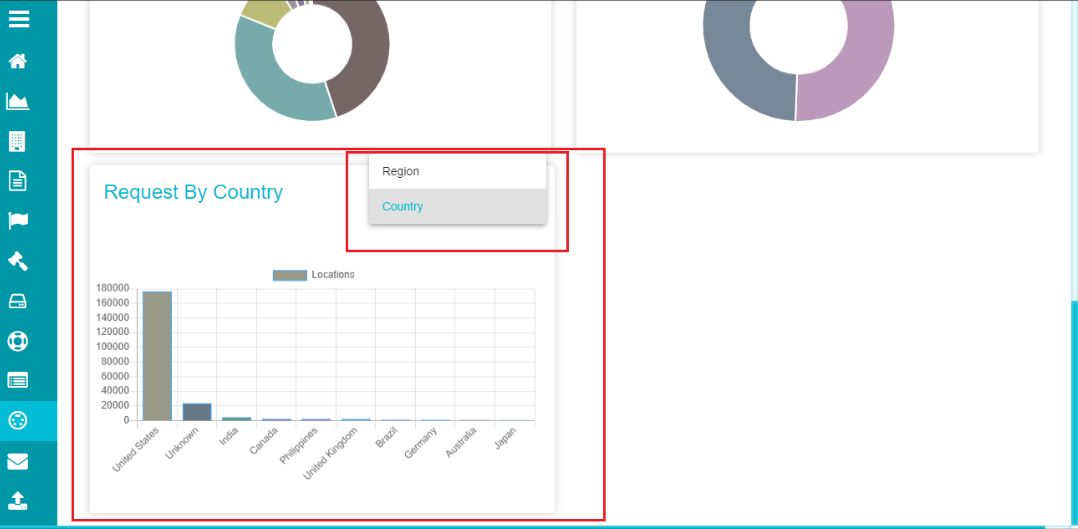
The vertical scale on the graph represents the number of consent requests received and the horizontal scale represents the region/country from which the requests are placed.