Data map Flows
Datamap Flows
Overview
Data Map flows illustrate the interactions between various Data Map systems, providing crucial insights into the data types shared between systems, their frequency, and the presence of sensitive data. These flows enable users to trace the path of specific information as it moves from one system to another.
Data Map flows can be created in three ways. Users can manually create Data Map flows directly on the datamap flow page, specifying the details of the interactions and data exchanges between systems. Data Map flows can be generated from survey responses on the Survey to Data Map configuration page. This method involves collecting data through surveys, which is then previewed and finalized on the Save to Data Map Preview page before the flow is created. Users can upload data files through the Uploads Module, which automatically processes and integrates the information into the Data Map flows.
Viewing a DataMap Flow
To view DataMap Flows, follow these steps:
From the hamburger menu, select DataMaps

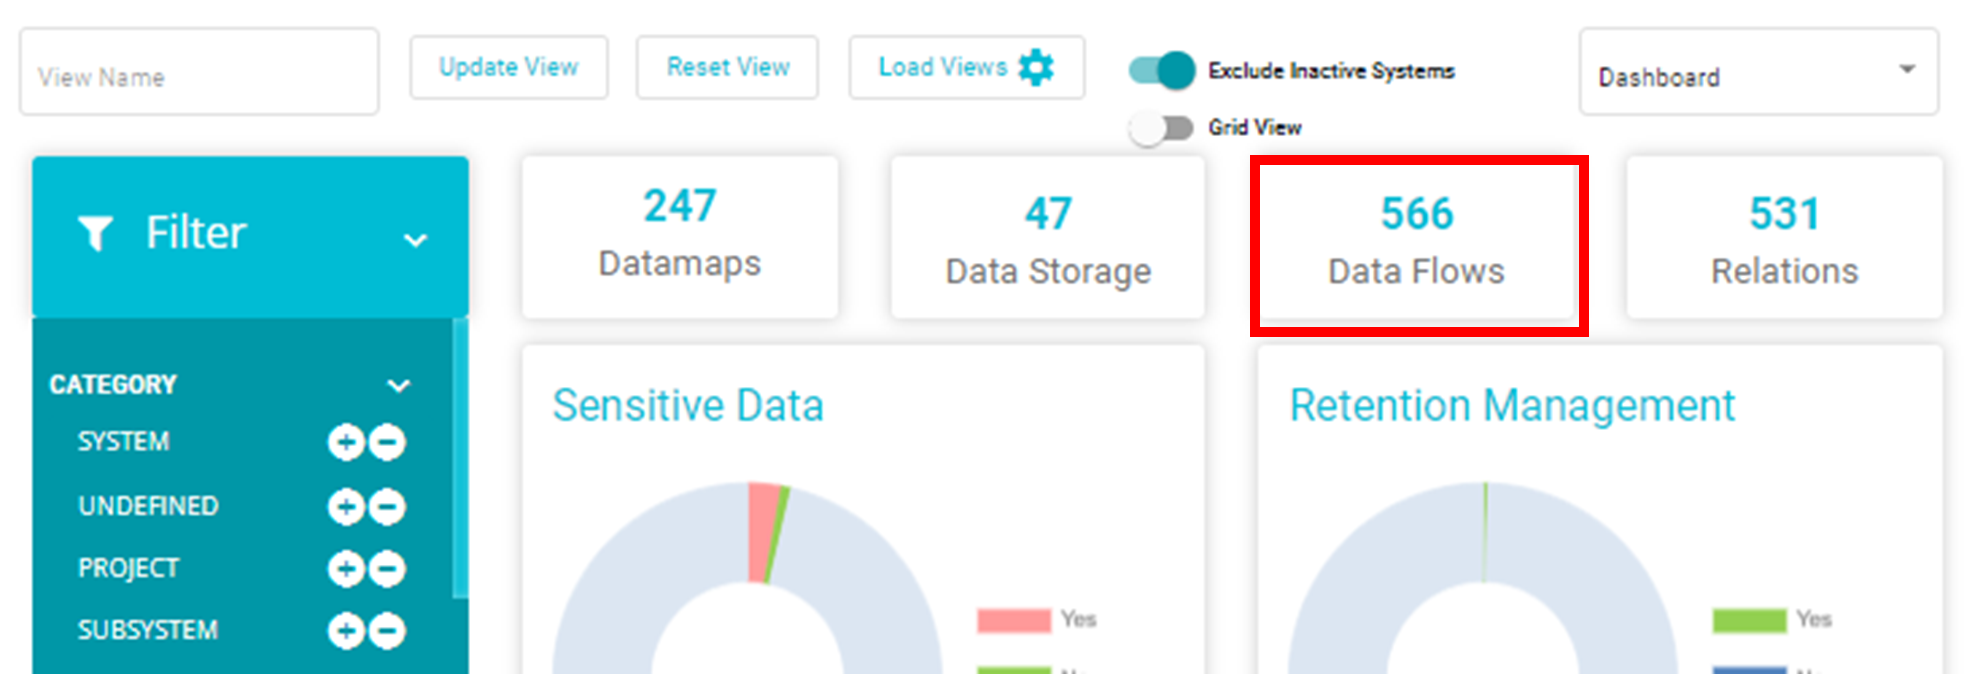
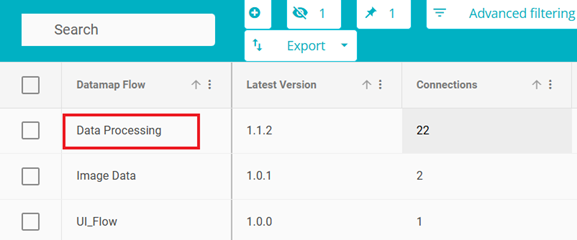
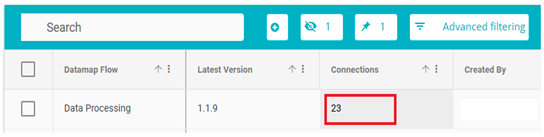
From the DataMaps page, click on Data Flows Note: The number on the DataMap Flows box shows the number of connections on all the unique connections.
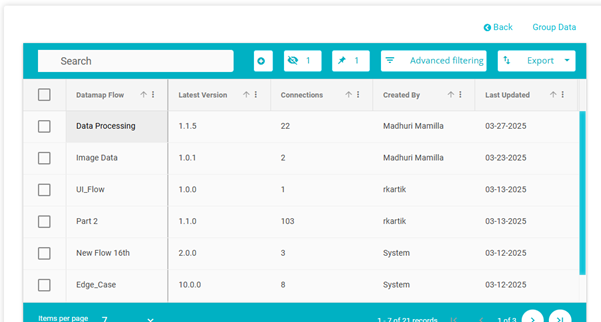
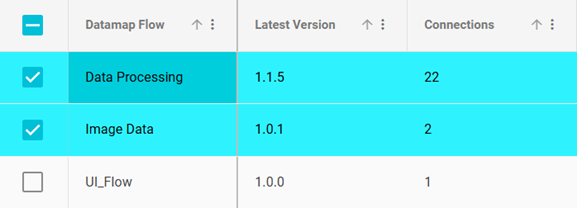
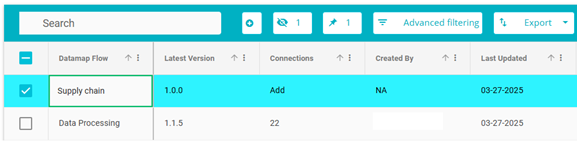
Here, the list of existing DataMap flows will be displayed.
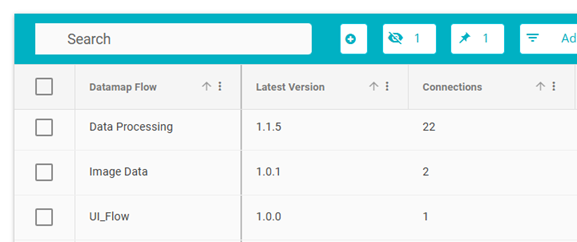
The different fields on the table are:
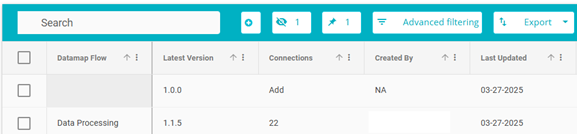
DataMap Flow: The title of that DataMap Flow
Latest Version: The version of the DataMap Flow created most recently. Information on creating different Flow versions is available below.
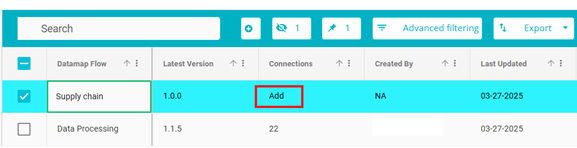
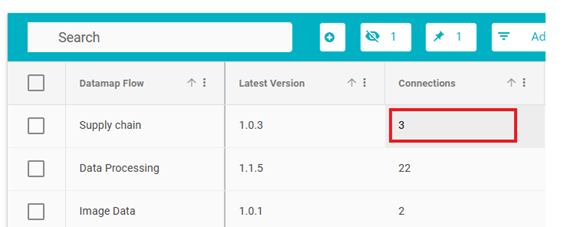
Connections: The number of unique interactions/connections between two different systems on the flow. Each flow can have any number of systems interacting with each other.
For example, there are 4 systems on the flow, named Data Integration, Data Enrichment, Data Validation, and Data Transformation. Data Integration and Data Transformation have 1 connection, Data Integration and Data Enrichment have 1 connection and Data Transformation and Data Validation have 1 connection. The total number of connections here will be 3.
Created By: The name of the user who created the flow. If the flow was uploaded via the Uploads module, this field will display as System.
Last Updated: When the flow was last worked on
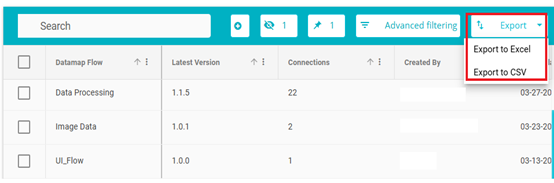
The DataMap Flow table can be exported in an excel or CSV format by clicking on the export button and selecting the required format.
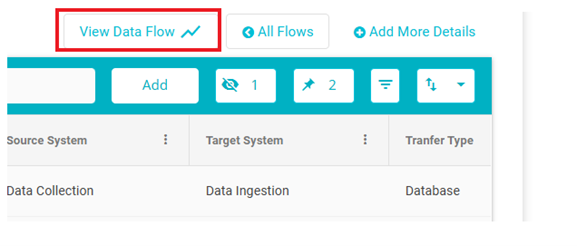
Click on the title of any flow to view it in a graph format
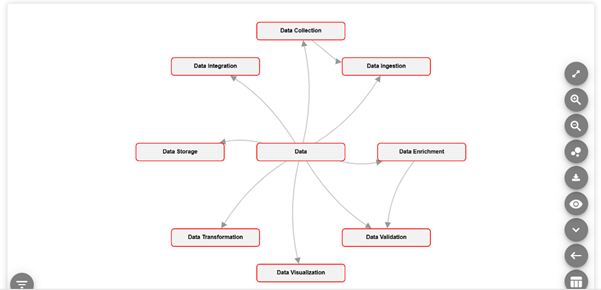
The graph view of the flow is displayed here

Note: By default, the initial 10 connections will be shown. The red border to the system indicates that it has column lineage.
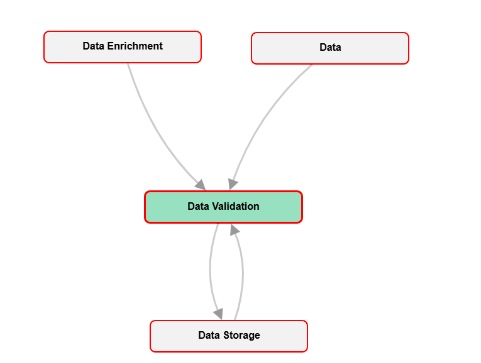
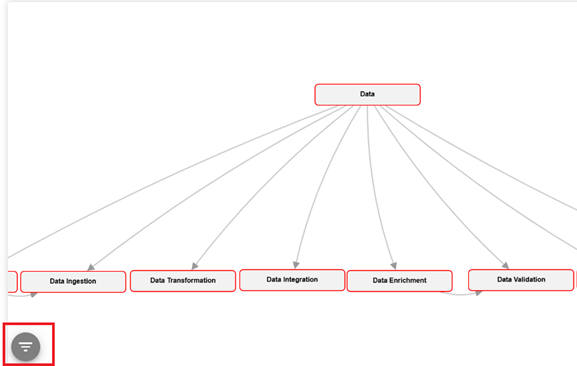
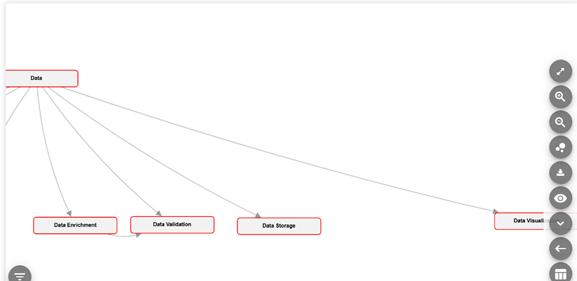
The graph displays the different systems connecting with each other
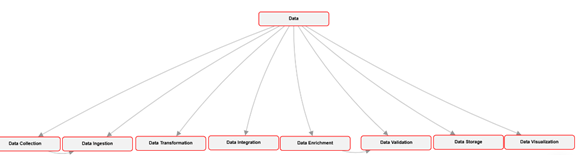
In this case, the System Data shares data with the System Data Integration. Here, Data is the source system and Data Integration is the target system.
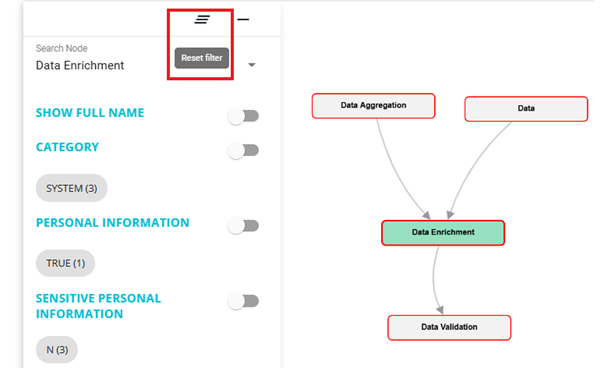
To view details like datatype, geolocation, transfer type, etc, hover over the arrow between the two systems
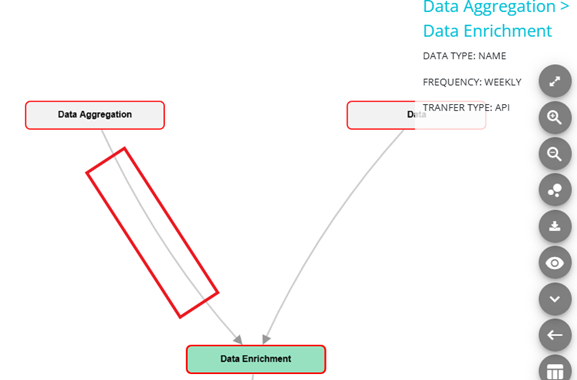
In the above example, on hovering over the arrow between Data Enrichment and Data Validation, we can see the transfer details. The source system is Data Enrichment, and the target system is Data Validation. We can see the type of data that Data Enrichment shares with Data Validation is PI or personal information. Transfer Type shows how the source system shares information with the target system, it could encrypted data, via API's and so forth. We can also see the frequency with which the data is shared.
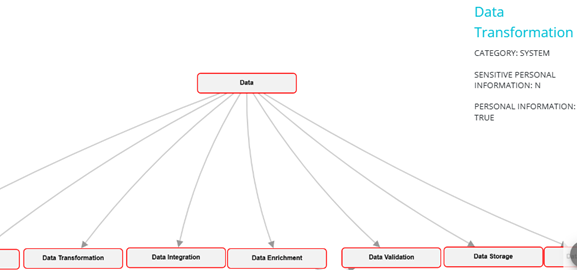
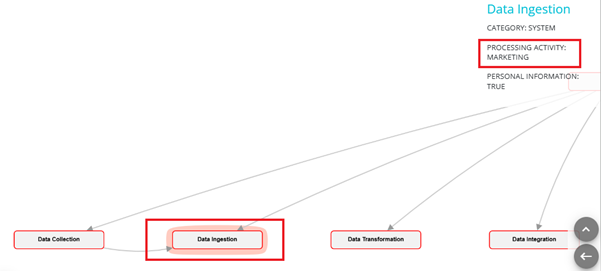
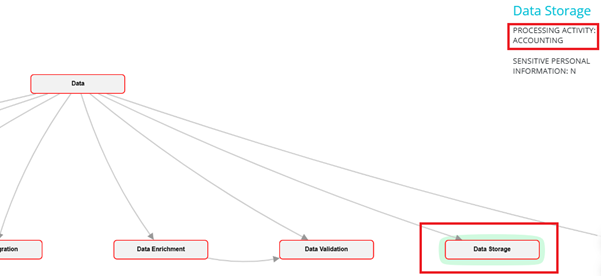
Hover over the system node to view the details of that system. In the example below, on hovering over Data Transformation, we can see the details for that system.
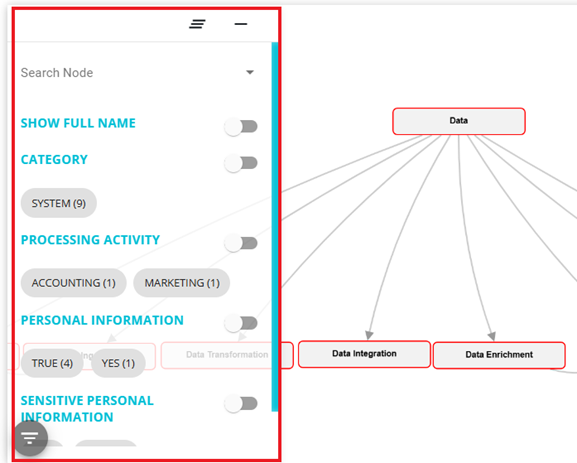
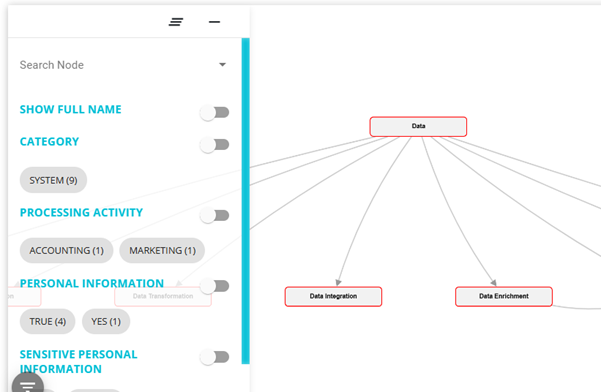
To filter the data on the flow, click on the filter button on the bottom left corner of the screen
The properties available for filters are being pulled up from the filtered systems.
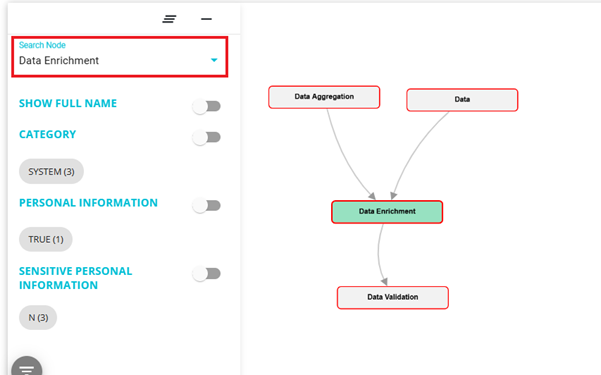
You can search any system using the search bar and the nearest connections of the system will be displayed on the screen as shown.
You can further filter this by enabling the group by filter toggle against any category and the system containing the selected option will be highlighted.
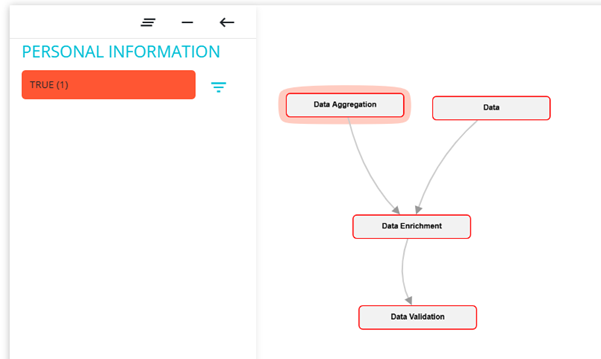
For example, if the Group By Filter toggle against Personal Information is turned on, then the systems contain Personal Information as "True" will be highlighted.
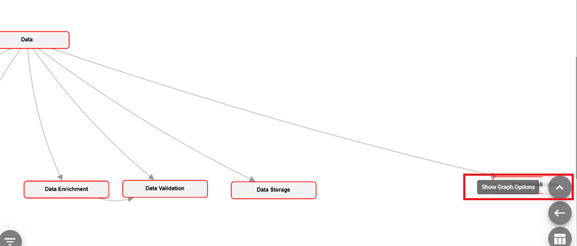
Show graph option will show all the options available.
You can save this view by selecting the views options.
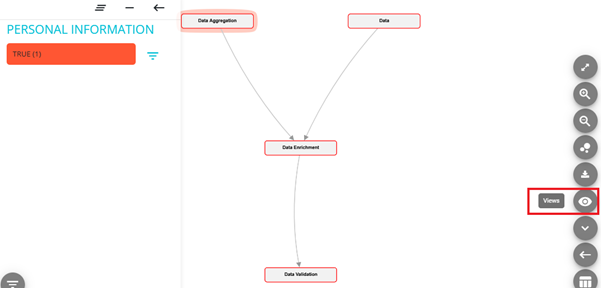
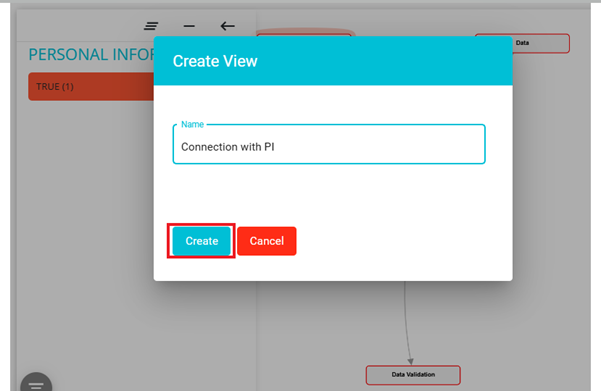
Once you select the views option a tab showing the names of existing systems and create view option will appear. To see an already existing view, you must click on the name of the view. To create a new view, click on the create view.

Once you click on the create view option this tab will appear on screen.
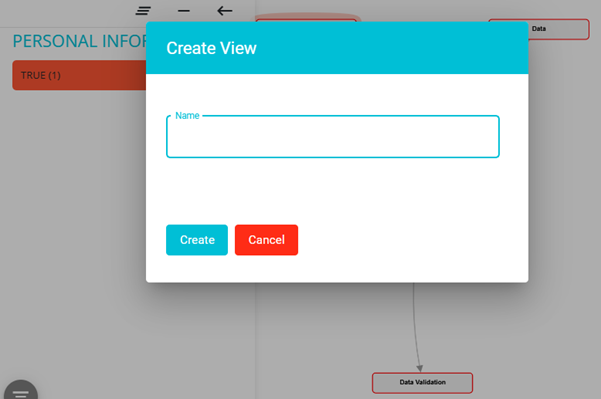
Give a name to the view and click on create button and the view will be saved.
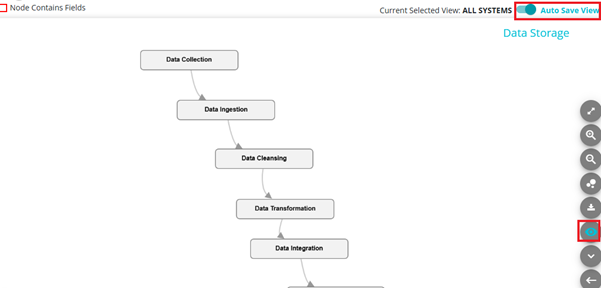
You can click on the name of it and the view will load. Once it is loaded, until you again click on the views icon it will be in view mode and will appear in blue colour. When user is in View Mode, there will be a Toggle available on the Top right called "Auto Save". If the same is enabled, the changes user makes will be auto saved if not, no changes will be made to the View.
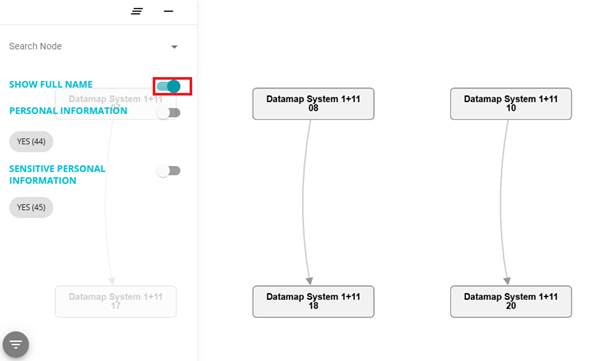
If you turn on the toggle against Show full name, the full name of the systems will be displayed on the Nods.
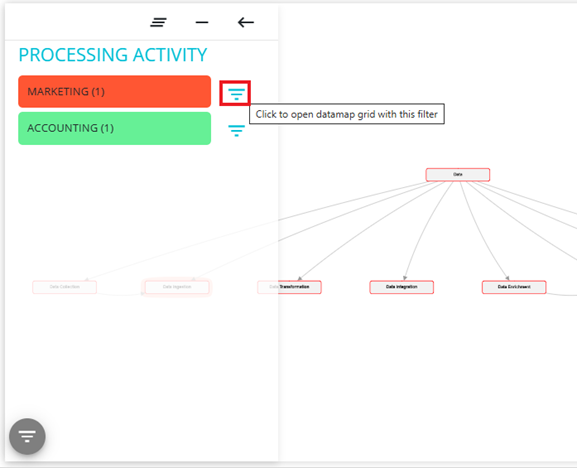
Click on Group By Filter under any category (Processing activity, Category, etc), the graph will highlight the systems containing the selected option. For example, if the Group By Filter toggle against Processing Activity is turned on, then the flow will highlight all the system's having different Processing activities in different colours.
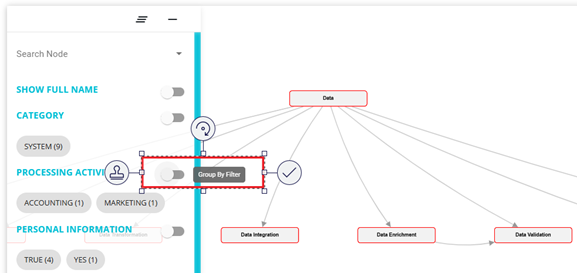
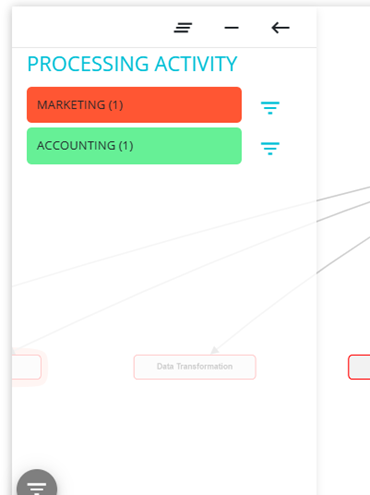
Here, the with system with processing activity Marketing will be highlighted in red colour and the system with processing activity Accounting will be highlighted in green colour.
The three at the top of the filter tab is to reset the filter, once you click on it the flow will go back to original view.
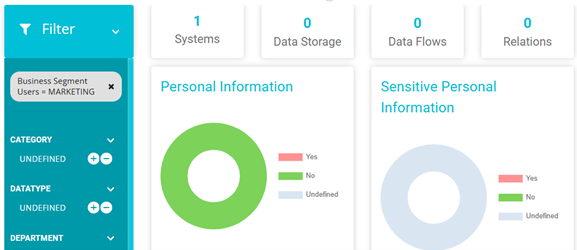
Click on the filter button against any option to be taken to the DataMap grid page for those systems. On this page you will be shown all the systems from this flow containing that option. For example, on clicking on the filter button beside Marketing, you will be redirected to the Datamap page showing all the systems from this flow with Marketing as processing activities
From here, you can go to the system details page of any of the systems from the flow having Marketing as processing activity.
The Inflow, Outflow etc options will be appear once you right click on the system name.
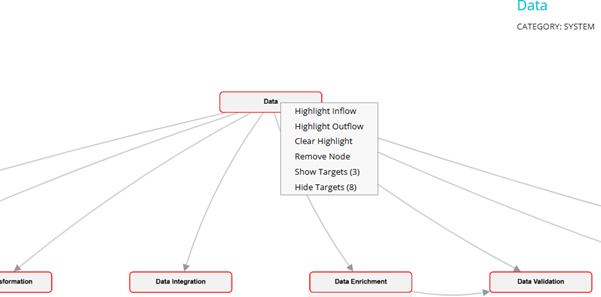
If you click on the Highlight Inflow all the systems that act as source for this system will be highlighted. If you click on the Highlight outflow all the systems that act as target for this system will be highlighted. For example, consider data validation system if you select Highlight Inflow option, the system Data and data enrichment will be highlighted.
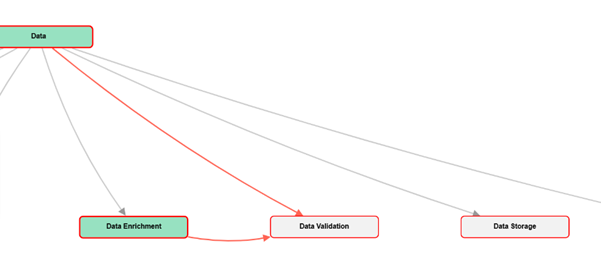
Clear highlight option can be used to remove this. Remove Node option will remove that system.
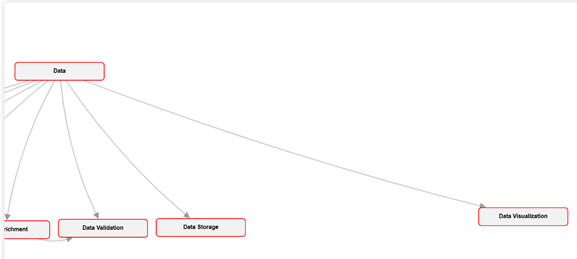
Click and drag any system on the flow to move its position. In the example below, System Data Visualization has been moved farther right. Changes made to the position of the system nodes are saved. In this example, whenever this flow is opened in the future, the position of Data Visualization will be as it is shown below.
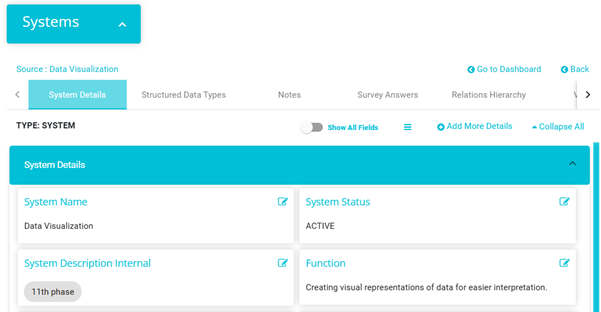
Double-click on any system to be directed to the System Details page for that system.
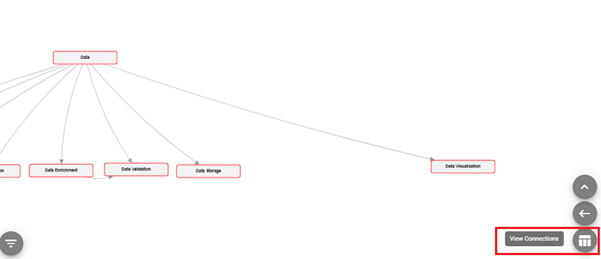
By clicking on View Connections icon in bottom right corner, you will be redirected to connections page of that flow.
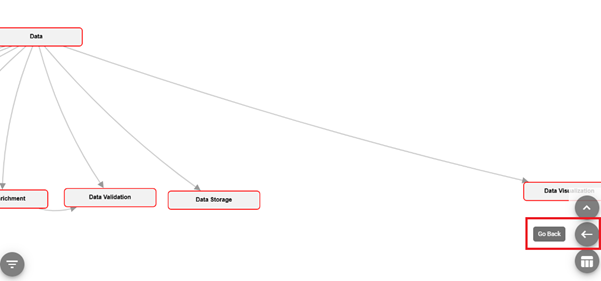
Go Back button will redirect you to the Data flows dashboard screen.
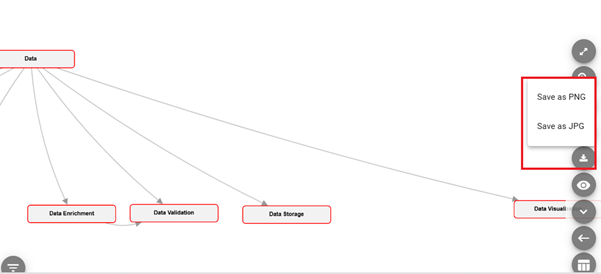
Export is used to download & save the flow in different formats (JPG, PNG etc).
The Layout option will show the flow in different layouts.
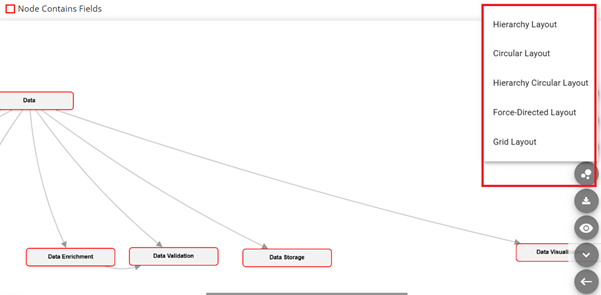
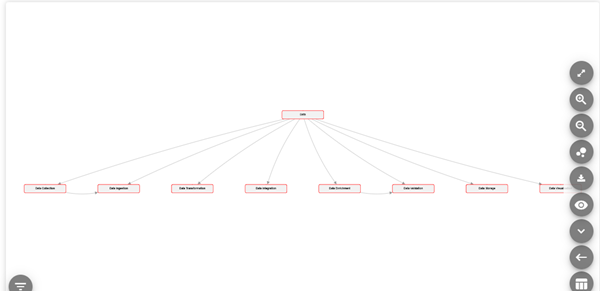
For example, Hierarchy Layout:
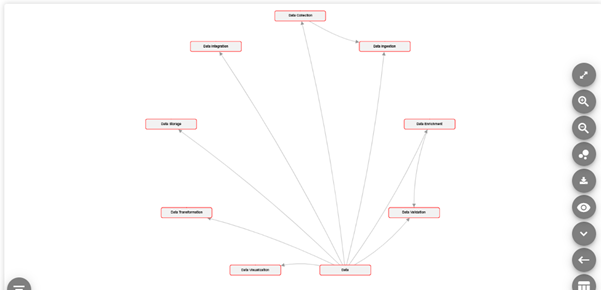
Circular Layout:
Hierarchy Circular Layout:
Zoom Out and Zoom In are used to Zoom in and out to clearly view the systems and fit screen is used to fit the flow exactly to the screen size. Multiple flows can be grouped together to display a comprehensive flow. To group multiple flows:
Tick the flows you want to group
Once the flows have been selected, click on the Group Data button
The selected flows will now be displayed as one flow
Note: This is not a permeant change. The grouped flow cannot be saved
Creating a DataMap Flow
DataMap Flows can be created in three ways. They can be created or updated through surveys; the configuration can be made on the Survey to DataMap config screen and finalized on the Save to DataMap preview screen. They can be uploaded via the file imports module. The guide can be found here - Upload guide - citations, DataMap, subsystems, DMF.docx,
Flows can also be created from the DataMap Flow page itself.
To create a flow from the DataMap Flow page, follow these steps:
From the DataMap Flow page, click on the Add button
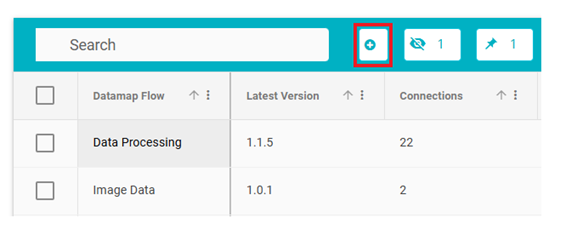
On doing so, a new flow row will appear
Type in the name of the new flow under the DataMap Flow Field
Next, click on Add under the Connections field
You will be directed to a new page, here you can enter the details of the flow
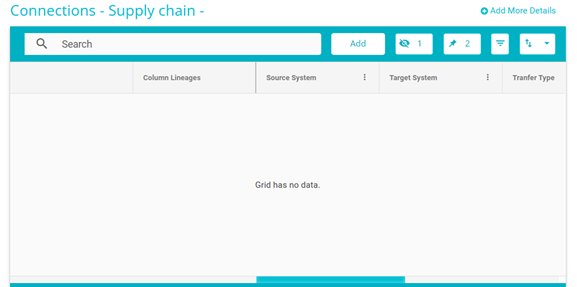
Click on the Add button to add the details of one connection
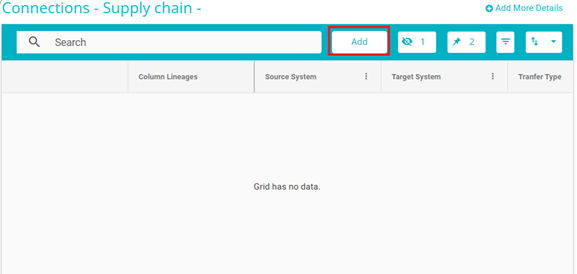
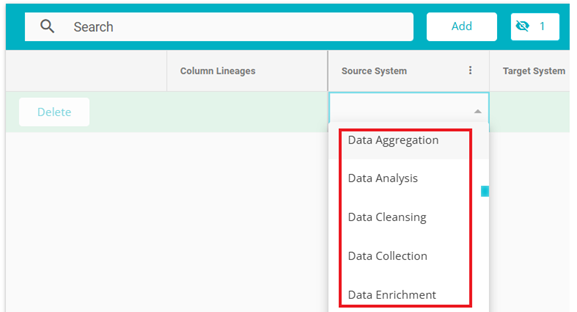
Next, you can double click on any field to add details to that field. From the drop-down menu, select the Source System.
Note: We show only top 100 data maps in the dropdown. However, if you search any system which is not present in the list it will be pulled up.
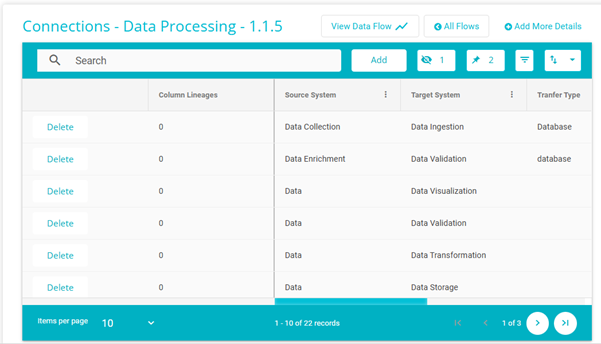
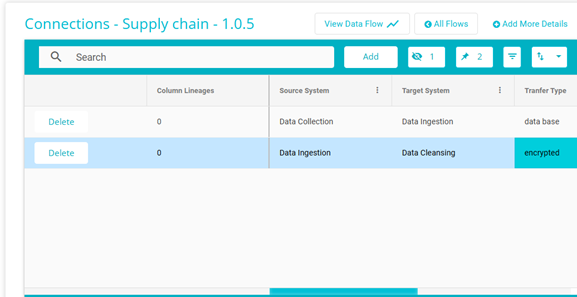
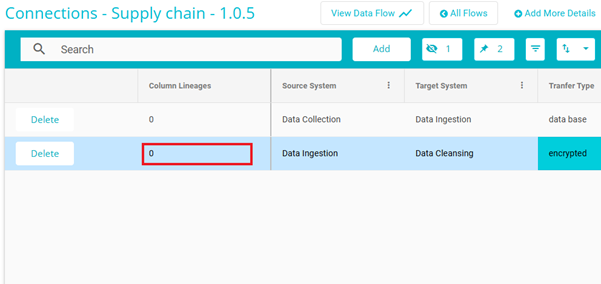
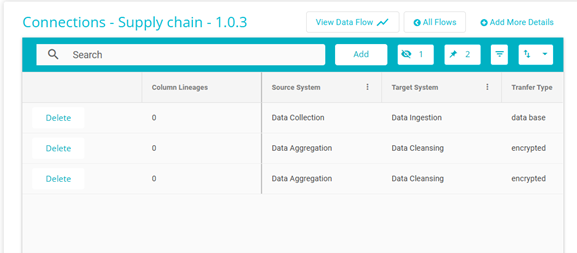
When a data flow has established connections, the Connections Column will display the number of connections associated with that flow. Clicking on the number will redirect you to the connections tab, where you can explore the specifics of each connection, including source and target systems, data types, and transformation details.
Here you also have the option to view it as a Data Flow.
Next from the drop-down menu, select the Target System
Note: Two of the same connections cannot be made. For example, if one connection has been made with Accurate as the source system and Box as the target system, then another system cannot be made with Accurate as the source system and Box as the target system again. Further, the Source and Target system fields cannot be left empty.
Multiple connections with their details can be added in the same way by clicking the Add button to create a new connection.
To add connection between systems, click on column lineages column. Lineages refer to the data's journey from its origin to its destination, including all transformations and processes it undergoes along the way. It provides a clear path of data movement, allowing users to trace the origin and transformations of specific data points.
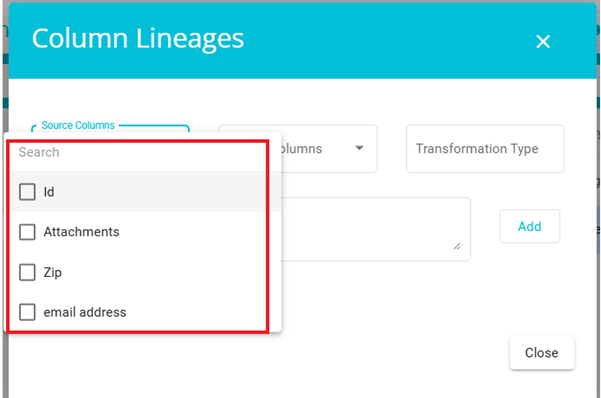
A popup will appear on screen, if both source and target systems both have structured data types.
Select source columns from drop down.
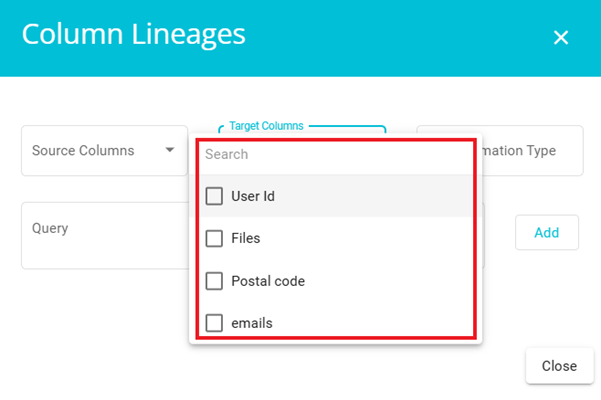
Select target columns from drop down.
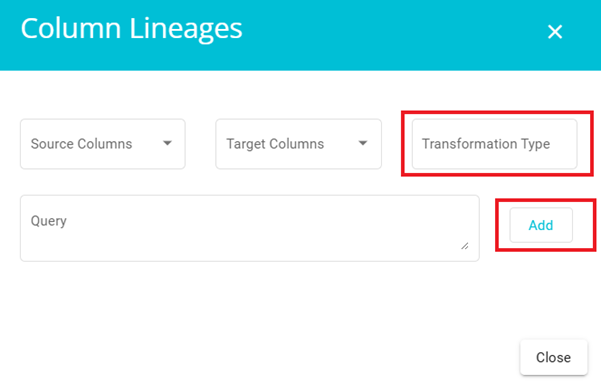
Give the transformation type required and click on add.
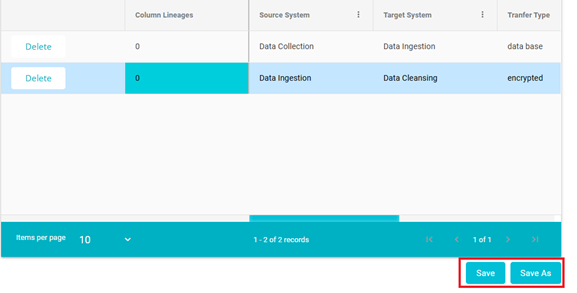
Once all the details have been added, click on the Save or Save as buttons available at the bottom right of the screen.
Examples of Major Versions -- 1.0.0 > 2.0.0 > 3.0.0
Examples of Minor Versions -- 1.0.0 > 1.0.1 > 1.0.2
Once the flow has been saved successfully, the following message will appear on the screen

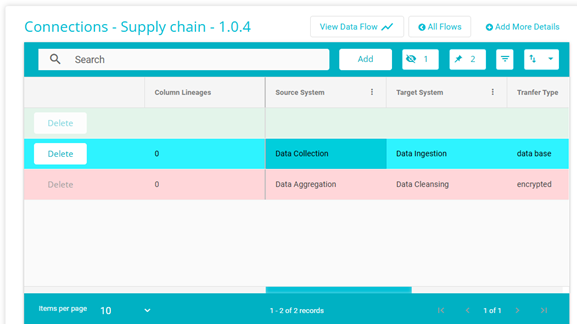
If you add a new connection, the row will appear in light green colour. If you click on a row, it will appear it blue colour and if you click on delete option of a row, it will appear in red colour.
To edit a flow, click on the Connections field of the flow you want to edit
The flow details page will open where you can make the required edits
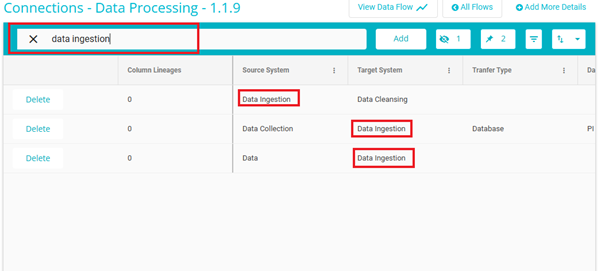
You can use search bar to find all the connections of any specific datamap system.
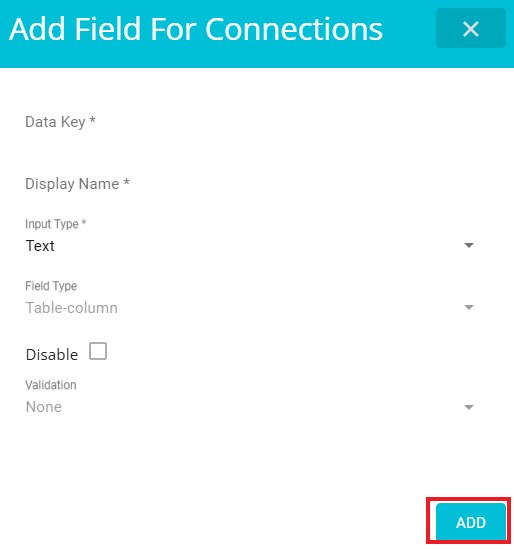
Click on Add more details button to include more columns like input type, display name etc for connections.
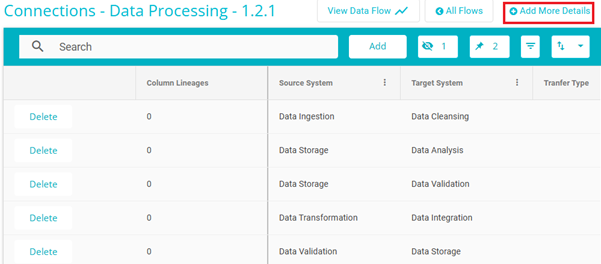
By clicking on Add button the new fields will be included.
Once the changes have been made, click on Save or Save As as required.
The flow details are also added to the System Details page of those systems. For example, System Data Validation is a part of the DataMap Flow -- Data Processing. This can be seen in the mapped flows field. This field shows all the flows that this system is a part of. Next, the Source to field shows all the systems that this system is a source system to. The Target to field shows all the systems that this system is a target system to. In this example, in the flow Data Processing, one connection has Data as the source system and Data Validation as the target system.
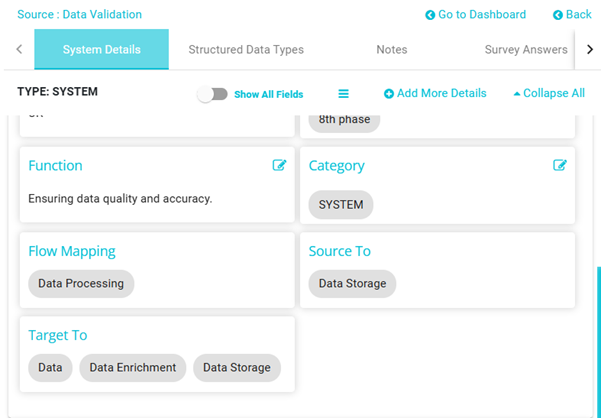
If you click on the flow under Flow Mapping, it will redirect you to the flow and that system will be highlighted and the source and target systems of that system can also be seen.