Admin Department Report
Admin Department Report
[Overview]{.underline}
The Admin Department Report provides a comprehensive view of the different departments within your company, their Processing Activities and the Systems associated with those processing activities in a chart format. The data on these reports is obtained from the data on the Datamap. From here, the charts can be exported as images files.
[Steps]{.underline}
To access the Admin Department Report, follow these steps: -
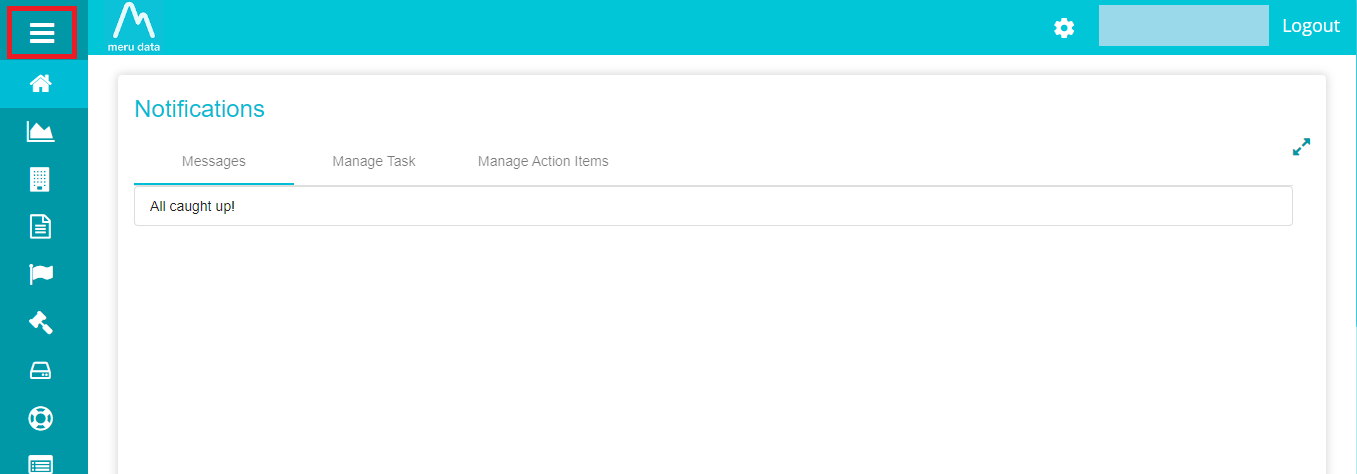
From the Data Governance Tool Main Screen, click the hamburger menu present on the top left corner of the screen. \
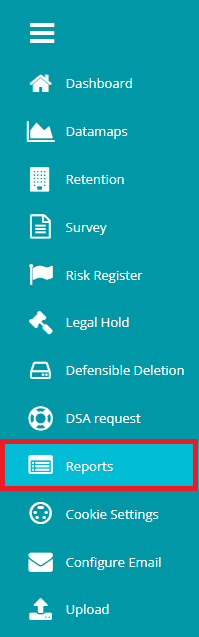
From the Menu, click on Reports\
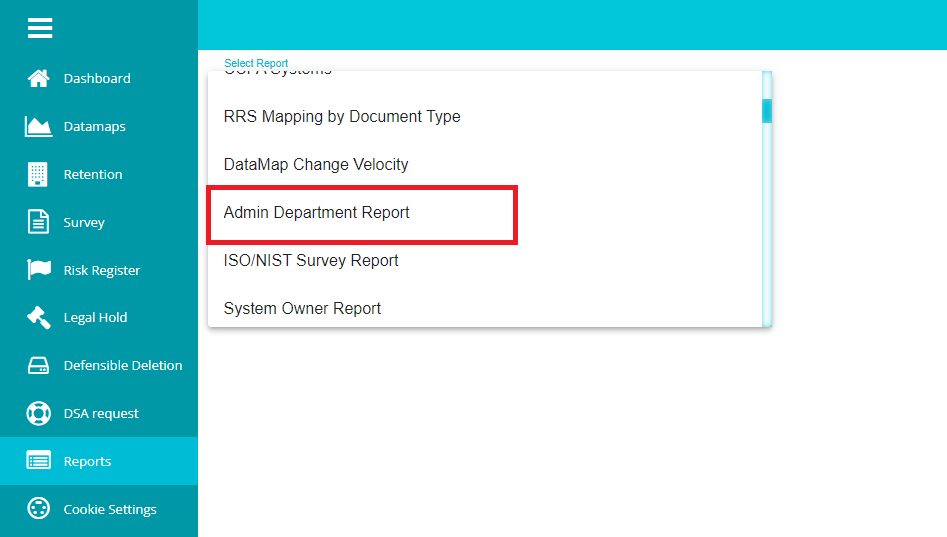
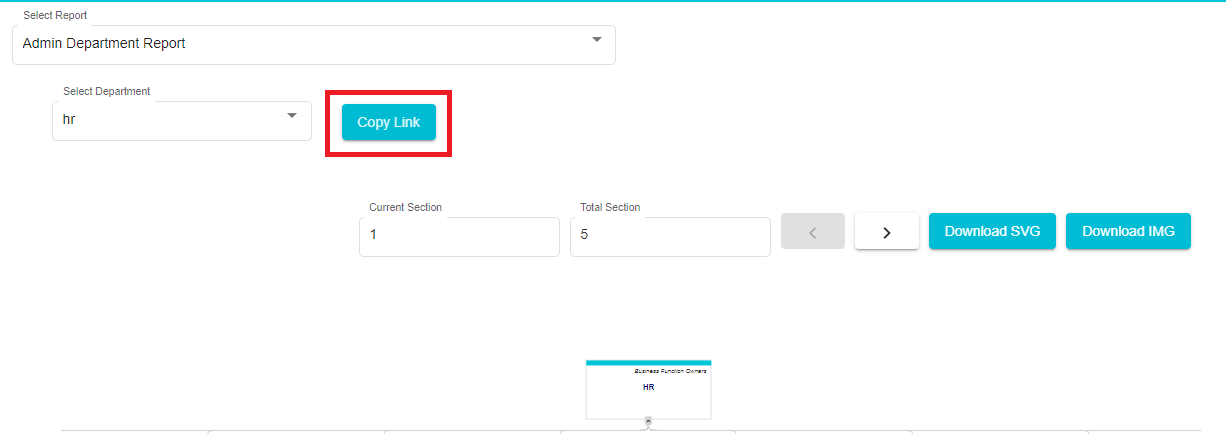
From the Select Report drop-down menu, select Admin Department Report\
Next from the Department drop down, select the Department of which you want to view the report. The list of departments here are obtained from the Business Function Owner fields from all the Datamaps.\ *Note: On the Datamap, Business Function Owner is the term used for Department.*\

Once the Department has been selected, the report for that Department will be displayed on the screen\
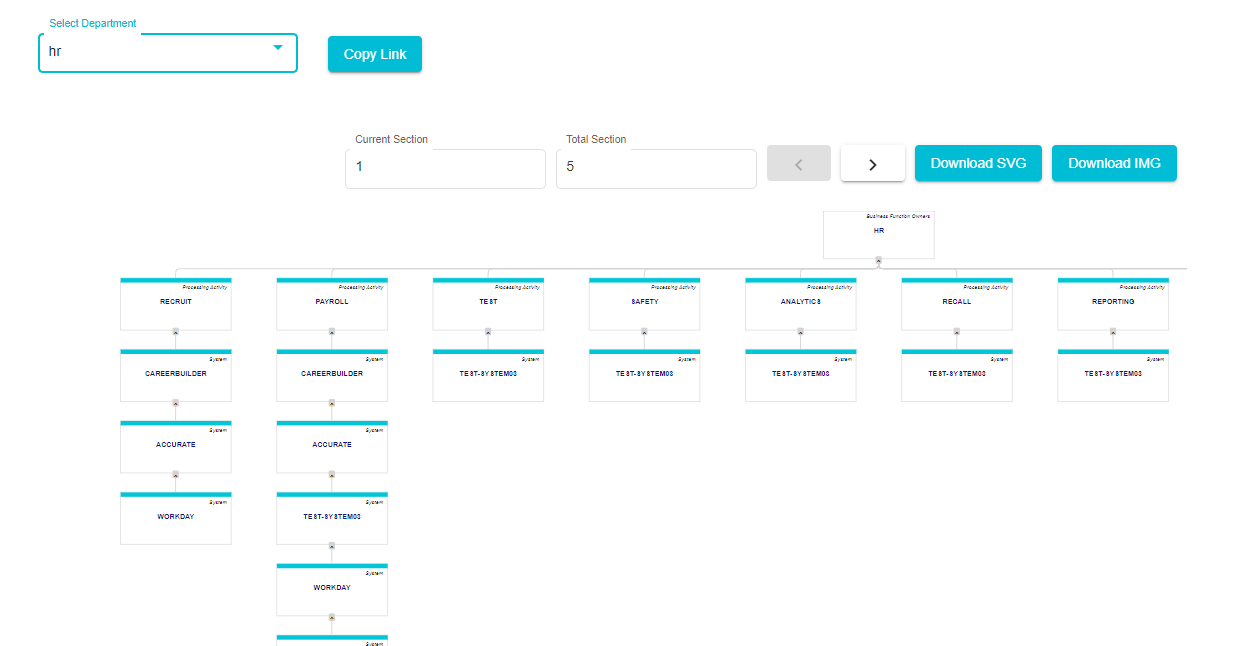
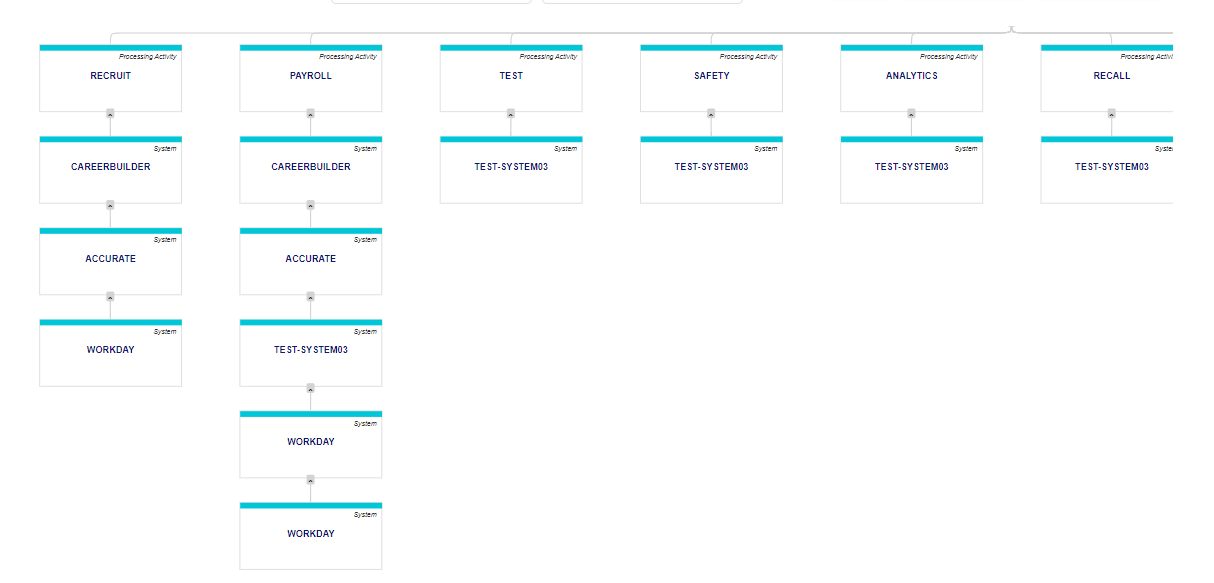
The Report displays the Department (Business Function Owner), the Processing Activities that come under that Department and finally, the Systems associated with those Processing Activities and that Department.\
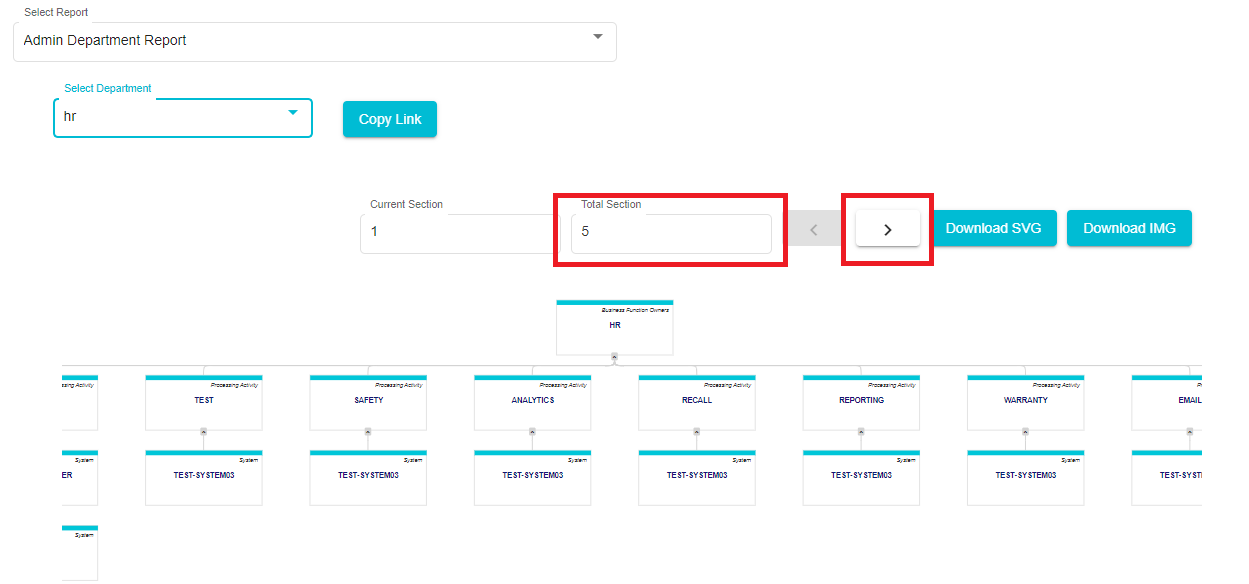
The bigger reports are divided into sections. The number of sections for the report is displayed under Total Sections. To move to the next section, click the right arrow to move to the next section\
The Report can be downloaded as an image or as an SVG file. The Report will be downloaded as a zip file. The different sections of the Report will be available as different images within the zip.\ *Note: SVG files provide better resolution when zooming in and out\
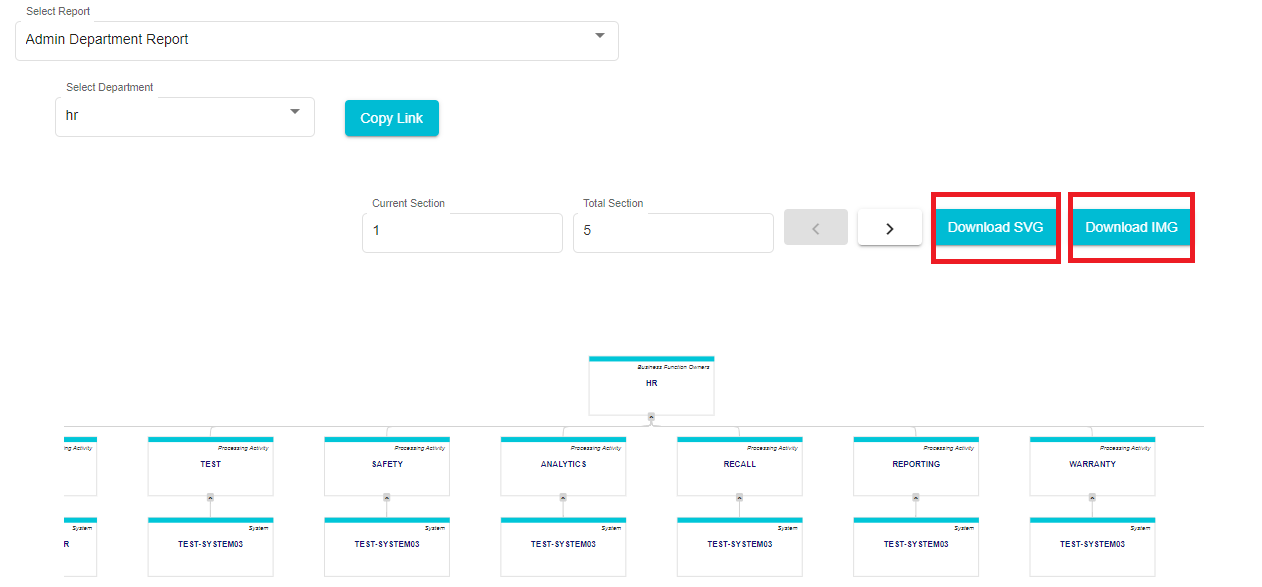 \
\Once the file has downloaded, the following message will appear on your screen
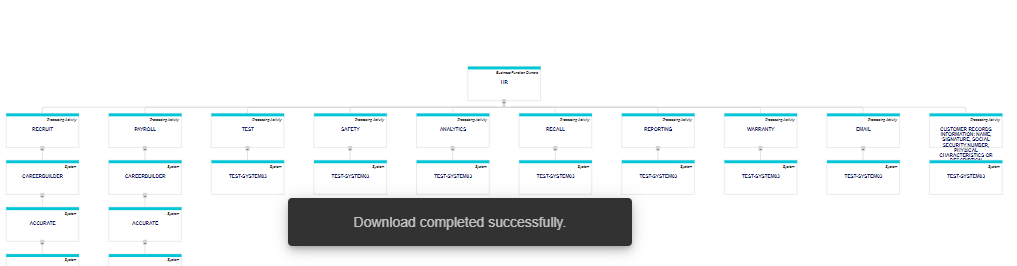
You can access the file on your report now\

To share the report without downloading the file, click the Copy Link button to get the link for that Department's Report\
Users not already signed in will have to do so to view the Report after clicking on the shared link.