Data Governance Tool Grid
Overview
Throughout the Tool, compiled data is presented in the form of a grid or table. This grid/table can be found in any module where data has to be listed in some order. The grid has multiple features and functions, which have been covered in this guide.
Grid Functions
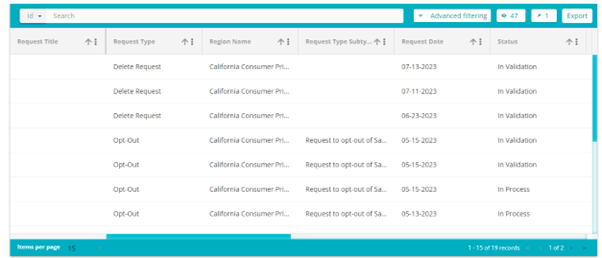
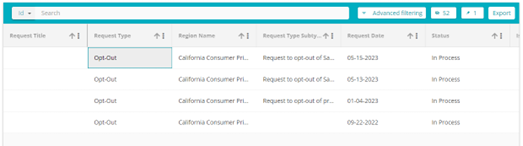
*Note: We have used the Active Requests DSAR Grid as an example for this guide. This grid shows us all the DSA requests that were received from requestors.*
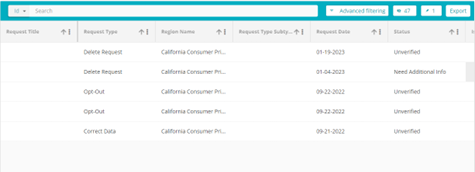
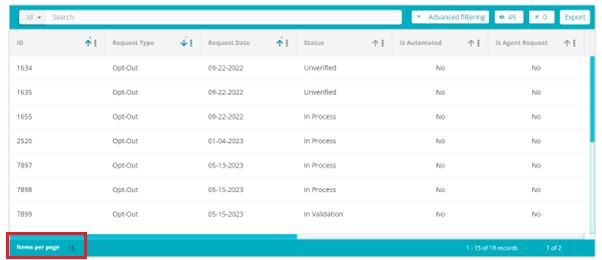
Depending on the number of values on the grid, the grid will be divided into pages and each page will display a certain number of values. In the example below, there are 19 active requests, and the first page displays 15 of those requests. The second page will display the remaining 4 requests.
Any searching, sorting, and filtering done on this grid will apply to the data from the entire grid, it is not restricted to the data available on this page.
- Search for ID/Email

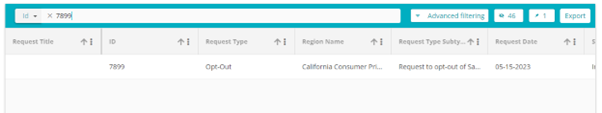
Once you select ID from the Search criteria drop-down, you can enter the value of any request ID and that request will be presented on the grid if the request ID value entered is valid. The same function can be performed by entering in the email address of the requestor. On doing so, any requests that have been sent in from that email address will be displayed on the grid.
In the example below, we have searched for the request with 7899 as its ID. The results were found and displayed on the grid as seen below:
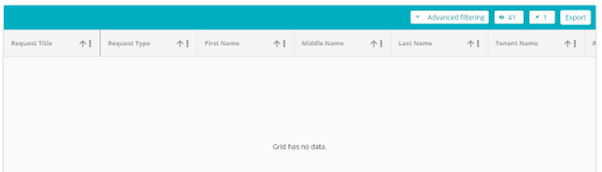
If the Search value entered is invalid, the following message will appear:
- Advanced Filtering
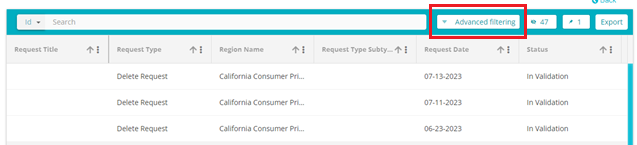
The Advanced Filtering feature is used to filter the data and obtain results based on multiple different criteria.
In the example below, we have filtered the requests to obtain all the Opt-Out Requests which are in the In Process stage, i.e., whose status is In Process.
To perform this filtering:
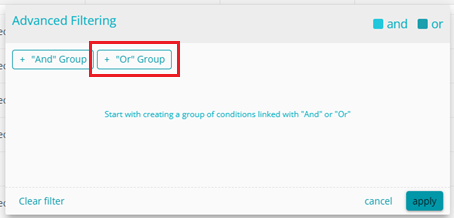
Click on Advanced filtering.
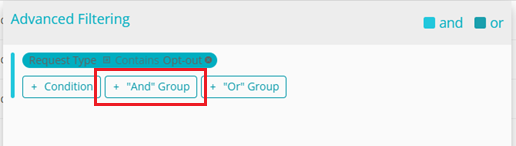
On the Advanced filtering pop-up that appears, click on the +And Group button
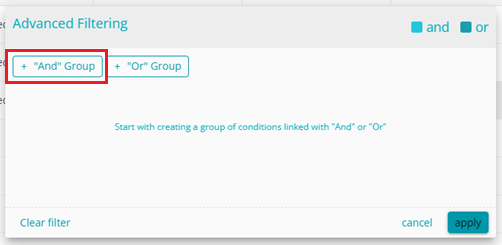
The +And function only provides those results that meet all the search criteria mentioned.
For example, if we search for Delete Data Request Types and Requests that came in from the location California, then the results will show only Delete Data request types from California. It won't show Delete Data requests from Colorado, nor will it show Opt-out requests from California. The +Or Group provides the combined results of all the search criteria mentioned
For example, if we search for Delete Data Request types and Requests that came in from the location California, then the results will show all Delete Data request types and all requests that came in from California.
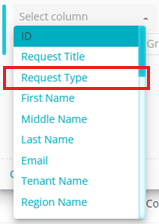
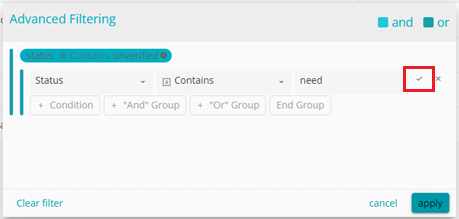
- Now you can define the search criteria
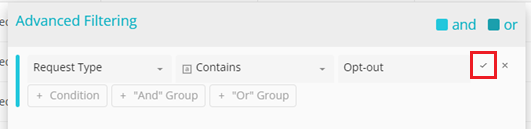
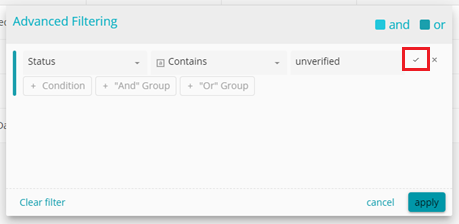
Select Column: From the drop-down menu, select the column on which you want to perform the search condition. Here we have selected the column Request Type. Meaning that the filter will be applicable to the Request Type column only.
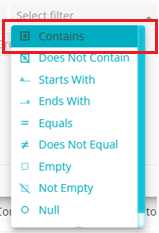
Select Filter: From the drop-down menu, select the condition/filter that will be applied to the selected column. Here we have selected Contains.
Select Value: Type in the value of the condition/filter. Here we have typed in Opt-out. This will search and filter the Request Type column to obtain the Opt-out Request Types, i.e., those Request Type names which contain the value Opt-out. This search condition is shown in the example below
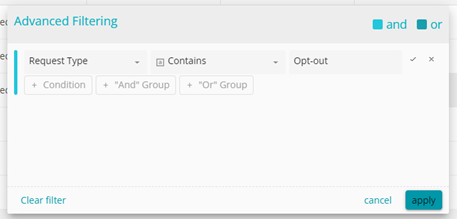
Once the condition has been defined, click on the tick mark next to the condition
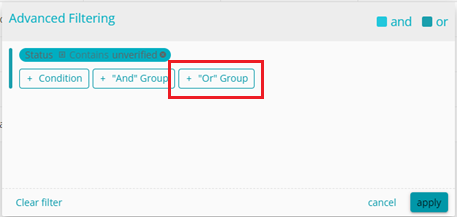
Next, click on the +And Group button to add the next And condition
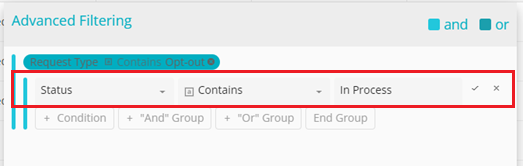
Now, in the same manner, define the condition to obtain the results for requests in the In Process stage, as shown below
Click on the tick mark and then click on the Apply button
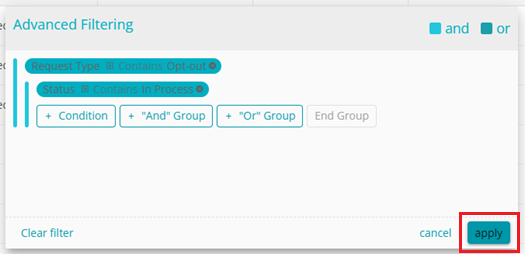
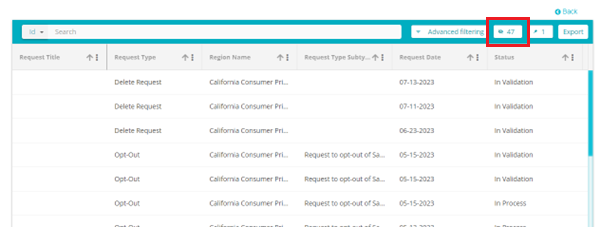
The grid now shows all the Opt-out requests that are in the In Process stage
An example of the Or function is given below. In this example, we have filtered the data to provide all the requests in the Unverified stage or the Need additional information stage. This function yields the results of both the criteria.
To perform this filtering:
Click on the +Or Group button
Next, define the search criteria and click the tick mark as shown below
Once the first condition has been defined, click on the +Or Group button
Add the second search criteria next and click on the tick mark
Once the search criteria have been defined, click on the Apply button
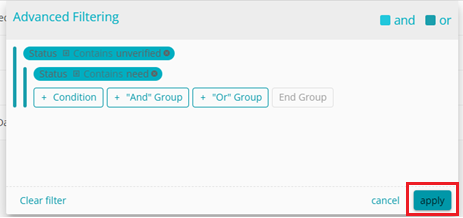
The grid will now show requests that are in both stages: Unverified and Need Additional Information
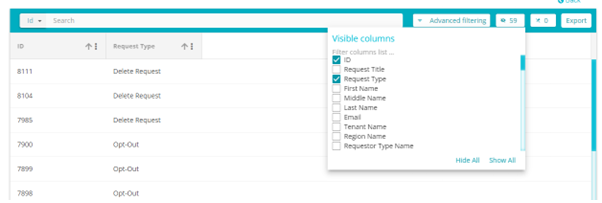
- Visible Columns
Here you can select which columns you want to see on the grid. Click on the Visible Columns icon to select the columns you want displayed
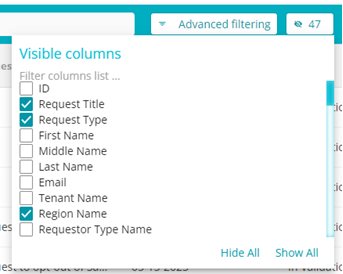
In the example below, only Request Type and the ID have been
selected and hence only those 2 columns are visible on the grid
- Pinned Columns
Pinned Columns will remain to the left of the grid regardless of any other columns that get added to the grid. Even when you scroll to the right of the grid, the pinned columns remain visible on the left.
Click on the Pin Columns icon to select the columns you want pinned on
the grid
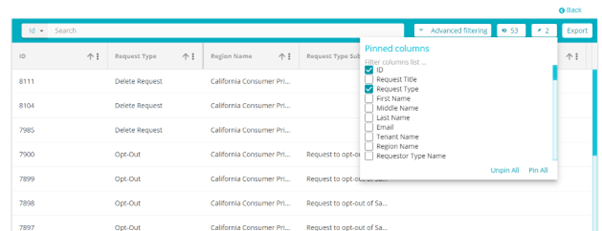
In this example, the ID and Request Type columns have been pinned.
- Sorting
The data within each column can be sorted and filtered using this feature. To sort any column, click on the three-dot menu of the column you want to sort

The sorting pane for that column will open
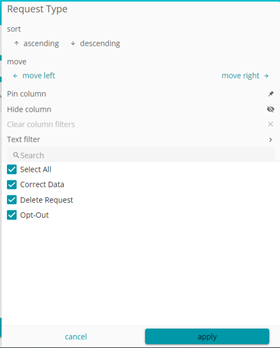
Here, you can sort the column in the following ways
Ascending: Click on ascending to sort the values in that column in ascending order. In the example below, the values have been arranged alphabetically in ascending order.

Descending: Click on descending to sort the values in that column descending order. In the example below, the values have been arranged numerically in descending order

Move left: Click move left to move the column one space to the left
Move right: Click move right to move the column one space to the right
Pin Column: Click on pin column to pin column on the grid. Pinned Columns will remain to the left of the grid regardless of any other columns that get added to the grid. Even when you scroll to the right of the grid, the pinned columns remain visible on the left.
Hide Column: Click hide column to remove this column from the grid display
Text filter: Use this field to search for any value on that column. In the example below, we have searched for all values with the number 2 in it.
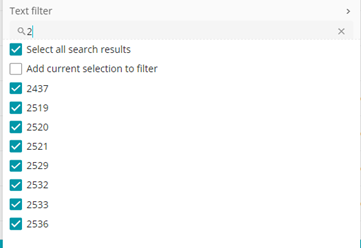
[Add Current Selection to filter:]{.mark}
Another way in which the columns can be sorted in an ascending or descending order by clicking on the arrow next to the column name

If the arrow is blue in color and pointed up, that means the column is in ascending order

If the arrow is blue in color and pointed down, that means the column is in descending order

Multiple columns can be sorted in ascending and descending order. In the
example below, the columns ID, Request Type and Request Date have been
sorted. In this case, Request type was sorted first and hence will take
precedence over ID and Request date. ID was sorted second and hence will
take precedence over Request date. This is shown in the numbers next to
each arrow.
 This means that first all the Request Type values will be arranged in a
descending order. Next based on the order of the Request Type values,
the ID values will be arranged in an ascending order. And lastly, based
on the order of the ID values, the Request date values will be arranged
in an ascending order.
This means that first all the Request Type values will be arranged in a
descending order. Next based on the order of the Request Type values,
the ID values will be arranged in an ascending order. And lastly, based
on the order of the ID values, the Request date values will be arranged
in an ascending order.
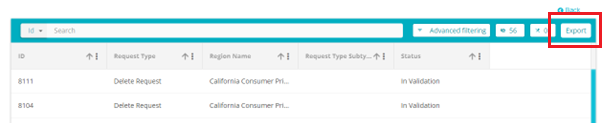
- Export
With this feature, you can export the data on the grid to your local device in an Excel or CSV format. The data on the grid can also be sent as an email in either of the two formats.
To export the data, follow these steps
Click on the Export button
From the drop-down menu that appears, select the format in which you want the data to be exported. In this example, we have exported the data in an excel format

Once the format has been selected, the file can be found on your local device under Downloads.
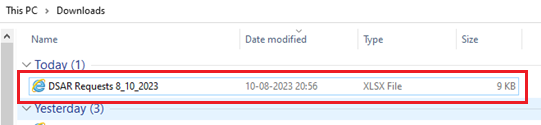
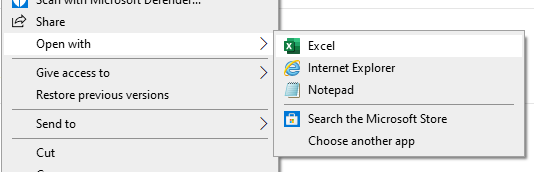
Right click on the file, hover over Open With and click on Excel
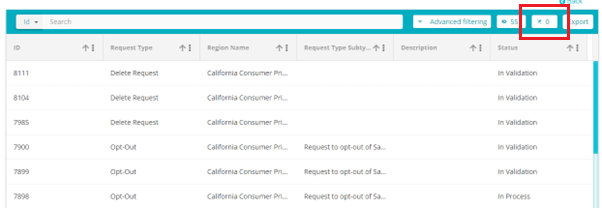
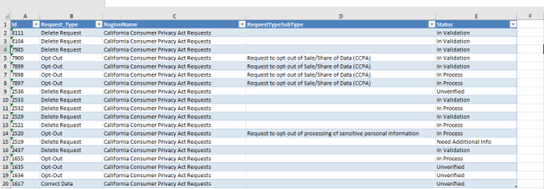
All the items on the grid, including any added filters, will be available on the excel sheet. The filters could include the visible columns, the results of advanced filtering, pinned columns and the sorting of any column. In the below example, only the ID, Request Type, Region Name, Request Type Subtype and Status had been selected as visible columns and hence only those columns are visible on the excel sheet.
- Items per page
The number of items visible on each page can be defined with this
feature
Click on the number besides Items per page and select the required number from table that appears

- Page Navigation
Navigate to the different pages by clicking on the arrow at the bottom
right of the page
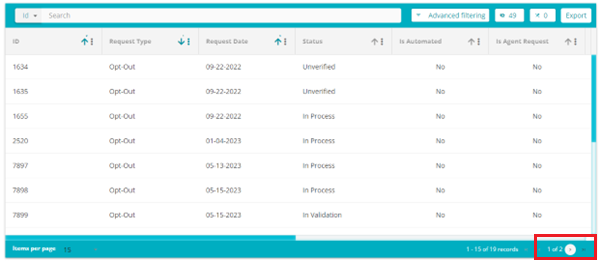
To go the next page, click on the single arrow
![]()
To go to the last page, click on the last arrow
![]()